We suspect that the markets are somewhat confusing these days as investor’s emotions swing quite rapidly between fear and greed. We tend to believe that any time the markets ‘make’ you do something it is almost always the wrong thing to do which explains, we suppose, why we are always in search of an overall perspective.
What do we think is going on at present? Our sense is that the markets are trying to come to grips with what appeared to be a major trend change around the start of this year. Our sense is that the trend change is being tested and that to date it is still somewhat unclear which way things are going to tip.
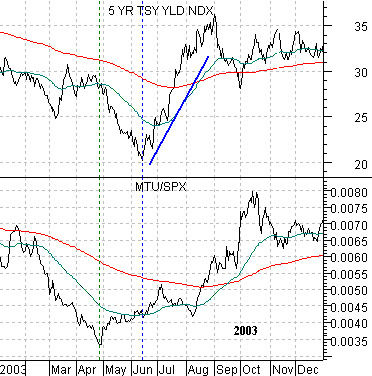
To help explain we have included a chart at top right of 5-year U.S. Treasury yields and the ratio between Japanese bank Mitsubishi UFJ (MTU) and the S&P 500 Index (SPX) from 2003.
We could have used 10-year or 30-year Treasury yields just as easily or, perhaps, a chart of the U.S. 30-year T-Bond futures or Japanese 10-year bond futures but this should suffice.
Last week the Fed intimated that additional monetary easing was not expected to be required. Whether this is true or not depends in large part on the direction for longer-term yields. If yield rise… then the Fed is correct. If, on the other hand, yields continue to decline then the markets are ‘saying’ that the Fed has more work to do. We have also argued that roughly a year should elapse between the end of Fed easing and the start of monetary tightening. Over this period long-term yields should resolve upwards.
The MTU/SPX ratio represents the trailing edge of the cyclical trend. It has to pivot to the upside with or ahead of yields. Once the laggard sectors begin to recover it is time for long-term yields to rise and the Fed to take its foot off of the gas pedal.
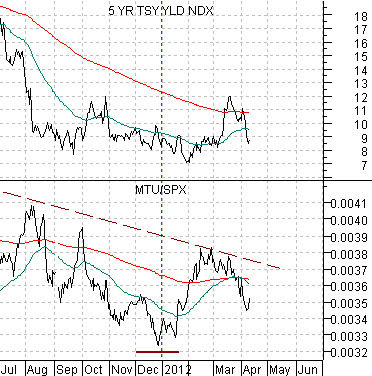
Below is the current situation. Notice that the MTU/SPX ratio turned upwards at the end of 2011. A month later yields began to rise. Now the markets are ‘testing’ the trend change. It is probably as simple as that. Does the MTU/SPX ratio move down to new lows with the process beginning once again at a later date or… does it hold the lows indicating that the path for yields is higher? Our lean is towards the latter outcome but it will take a bit more time before this is finally sorted out.
Equity/Bond Markets
Below is a comparison between gold futures, the price spread between crude oil (WTI) futures and Brent crude futures, and the sum of the share prices of Cisco and Intel (CSCO + INTC).
In a sense the recovery began to form last August. This was the point in time when three things happened. First, gold prices peaked. We have argued that gold is the offset or inverse to the pressures on the financial sector. Second, the gap between Brent and WTI reached its widest point. This is a measure of ‘stress’. Third, the large cap U.S. tech sector began to rally. We use a combination of Cisco and Intel to represent this.
If the recovery remains intact then gold prices should continue to trend lower, the spread between Brent and WTI should narrow, and the share prices of Cisco and Intel should continue to rise. Fair enough.
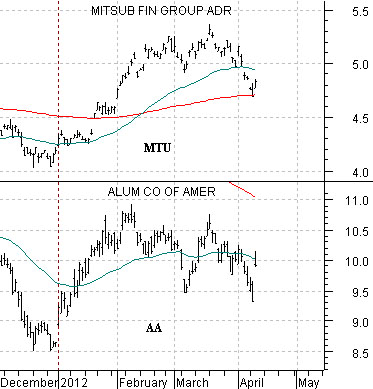
We have mentioned Alcoa quite often in recent days although we probably haven’t explained why it is so important. Alcoa represents a number of themes. It is a ‘laggard cyclical’ and it also trends with the investment theme that we believe should now be emerging. We will expand on the latter point somewhat on page 5.
Next is a chart of 10-year Treasury yields and the ratio between Alcoa (AA) and gold producer Newmont (NEM). The argument here is that the AA/NEM ratio represents the same kind of trend as the MTU/SPX ratio from the first page. If AA is rising relative to NEM then there should be upward pressure on long-term yields.
Last we compare Alcoa with Mitsubishi UFJ. If both stocks represent the ‘laggard cyclical trend’- the trend that has to turn higher ahead of long-term interest rates- then both should be following similar paths. If AA’s earnings had disappointed with the stock moving back to or below the recent lows then we would have to accept that a critical trend change/pivot was still somewhere out in time. The initial bullish reaction, however, tilts the scales somewhat towards a more positive outcome.