From Bloomberg yesterday, “Japan used so-called stealth intervention in November as the government sought to stem yen gains that hammered earnings at makers of exports ranging from cars to electronics.”
Whether ‘stealth intervention’ makes sense or not the reality is that Japanese Finance Ministry data shows that over $13 billion worth of yen sales were conducted during the first four days of November.
The argument is and has been that the yen is trading in the same direction as the long end of the U.S. Treasury market and… that there is a relationship between the trend for the euro versus the yen compared to the share prices of many of Japan’s large cap consumer products exporters.
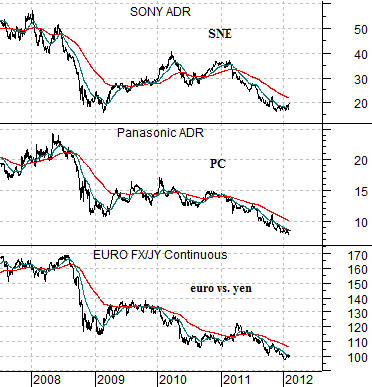
Below is a comparison between Sony (SNE), Panasonic (PC), and the cross rate between the euro and yen.
The chart suggests that an upswing in the euro versus the yen combined, we expect, with a strengthening dollar relative to the yen would remove a considerable amount of pressure from both SNE and PC. That was, more or less what happened in trading yesterday as the yen declined against both the dollar and the yen.
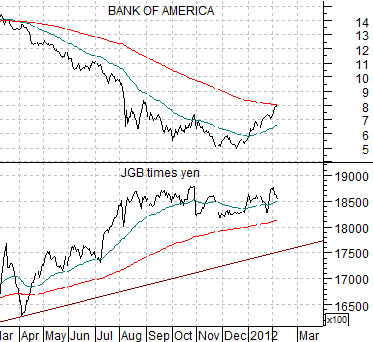
Below is a comparative view of the share price of Bank of America (BAC) and the combination of the Japanese 10-year (JGB) bond futures times the Japanese yen.
The defensive trade that has gone with what feels like a never ending series of crises since 2007- 2008 includes strength in the U.S. and Japanese bond markets as well as the Japanese yen. A return to a more optimistic trend would therefore include a weakening of Japanese bond prices and a down trend for Japan’s currency.
The argument here is that rising Japanese bond prices and yen go with the bearish trend that has plagued the banking sector. The stronger the recovery for laggard banks such as BAC the greater the offsetting pressure on the combination of JGB times yen. Given that we are positive on the laggard banks we must necessarily be negative on long-term bond prices and Japan’s currency.
Equity/Bond Markets
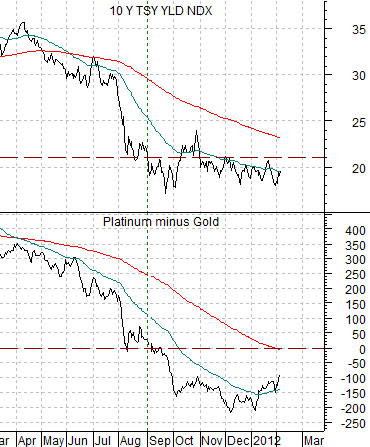
10-year Treasury yields bottomed around 2.1% at the end of 2008. At roughly the same time the spread between platinum futures and gold futures declined to ‘0’. In other words at the low point for yields the price of platinum converged with the price of gold.
Fast forward to the present time period. 10-year yields are holding below 2.1% while platinum futures prices have declined below gold prices. The markets are cycling almost daily back and forth between positive U.S. employment data and negative news from the Eurozone and/or China.
Our argument is that yields will lift back above 2.1% as platinum prices rise up through gold prices.
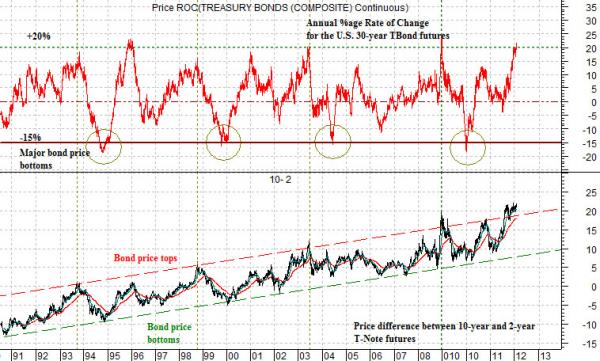
Below is an interesting chart comparison. It features the price spread or difference between 10-year and 2-year Treasury futures and… an annual percentage Rate of Change (ROC) for the 30-year T-Bond futures.
The 10-2 spread follows bond prices. When it is ‘high’ it means that bond prices are high and when it is ‘low’ bond prices in general are also low. Based on the channel that has defined its trend for more than the past decade… bond prices are currently ‘high’.
The bond market tends to be ‘high’ when the TBond futures are up 20% on a year-over-year basis and ‘low’ when the annual Rate of Change is close to -15%. At present the indicator suggests that bond prices are in the vicinity of a multi-year price peak.
When we put these two indicators together we come up with the conclusion that bond prices are destined to head lower similar perhaps to the end of 2008 and mid-2003.