We have argued of late that while we are positive on the U.S. equity market there are a couple of relationships that could alter that view. We can make the case that if the Japanese bond market peaked in price last month that 2010 could be quite kind to the Nikkei (more on this in tomorrow’s issue) but for now we would like to focus on the two charts that may serve as ‘stops’ for our bullish perspective.
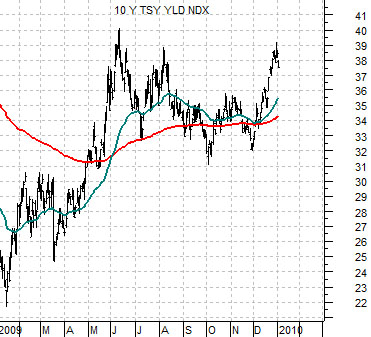
Below is a chart of U.S. 10-year Treasury yields.
The argument is that as long as yields are rising the cyclical trend will remain positive. The ‘stop’ for our view would require yields not only falling below the 200-day e.m.a. line but also remaining below that level long enough for the 50-day e.m.a. line to ‘cross’ down through the 200-day. The chart shows just how close we came to heading for the hills towards the end of November as the moving average lines converged.
The recent rally for long-term yields has pushed the markets away from the decision line and provided us with enough breathing room to get us through the next month or so.
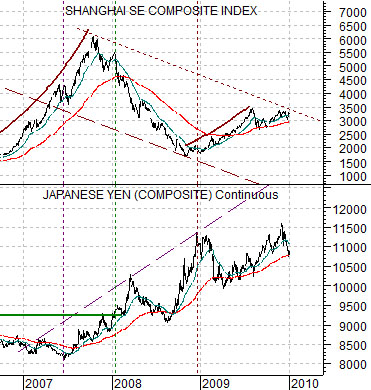
Below is a comparison between China’s Shanghai Composite Index and the Japanese yen futures.
The argument would be that one of the first markets to turn higher to signal downward pressure on asset prices was the Japanese yen in mid-2007. As the yen broke to new recovery highs towards the end of that year the Shanghai Comp. broke to the down side. Weakness in the yen following the surge to yet another peak at the end of 2009 marked the start of a broad recovery in the Chinese shares market.
To the extent that yen strength has gone with a negative trend in the Shanghai Comp. since 2007 then additional yen strength in 2010 could be a harbinger of future problems. We noted in yesterday’s issue that there is a tendency for the Asian equity markets to turn lower months ahead of the commodity market so the fact that the Shanghai Comp. has run close to 6 months with out making new highs raises a small caution flag.
Our view is that if the yen manages to push to new highs this year then we should spend some time reviewing our bullish position. There have been periods of time in the past when falling Asian shares have led to accelerating strength in the SPX so we will have to think long and hard about this if, as, or when.


Equity/Bond Markets
The autos and airlines were stronger in trading yesterday in response to the following report:
Jan. 5 (Bloomberg) — Ford Motor Co., Toyota Motor Corp. and Honda Motor Co. posted U.S. sales gains in December that beat analysts’ estimates as the industry showed signs of stabilizing after its worst year in almost three decades.
The markets continue to focus on the weather- something that seems to happen around this time every year.
Accuweather.com: – Brutally cold conditions are gripping nearly the entire eastern half of the country, including Florida. Temperatures this extreme have not been experienced since 1985. New waves of cold air will spread southward from Canada in coming weeks and could result in this winter rivaling even that of 1982 and perhaps 1977-78. Some of the greatest temperature departures from average may be yet to come from the balance of January into February and March.
Energy prices have been stronger on the prospect of rising demand for heating oil and natural gas. On the other side of the coin blizzards and freezing temperatures tend to discourage travel.
Jan. 5 (Bloomberg) — U.S. gasoline consumption fell to the lowest level in more than 13 months as Americans drove less between Christmas and New Year’s Day, MasterCard Inc. said.
Not, perhaps, a good day for global warming enthusiasts.
Jan. 5 (Bloomberg) — Record snows and cold stretching from China to the U.K. to Florida are threatening crops and disrupting travel while sending futures prices higher for orange juice, cattle and hogs.
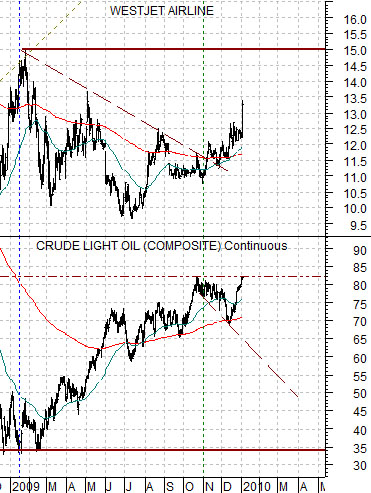
Below we show a comparison between Canadian airline WestJet (WJA on Toronto) and crude oil futures. We are using WJA to represent the broader ‘autos and airlines’ theme.
The basic point is that while cyclical is cyclical… the markets tend to drive one sector higher until it reaches or approaches a peak before rotating out to new sectors. In other words strength in WJA should show up around the time that energy prices rise to some sort of peak. Obviously the push back above 80 by crude oil should be a negative- if the markets were trading as if crude oil prices were still in a strong and rising trend. As long as WJA continues to strengthen the sense is that oil is basically range-bound between the moving average line (close to 70) and the recent highs in the low 80’s.
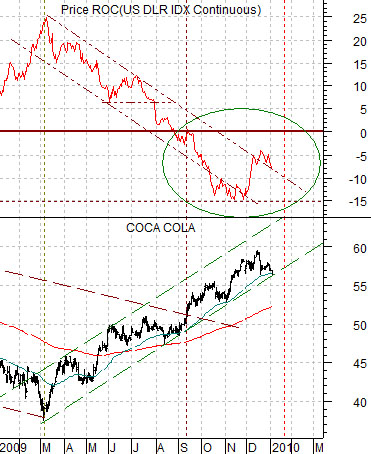
Below is a chart comparison of the share price of Coca Cola (KO) and the annual percentage Rate of Change indicator for the U.S. Dollar Index (DXY) futures.
The argument is that Coke has substantial non-U.S. revenue so a weak dollar will increase earnings as profits are translated back into dollars. The basic relationship over the past number of years has been inverse which simply means that KO tends to be better when the dollar is falling on a year-over-year basis and worse when the dollar is rising.
The markets expect that KO’s 4th quarter numbers will be fairly robust in comparison to the final quarter of 2008 given that the dollar went negative on a year-over-year basis in September. At present KO is under some pressure as commodity prices strengthen in response to below-normal temperatures as freezing conditions threaten the Florida citrus crop later this week.


