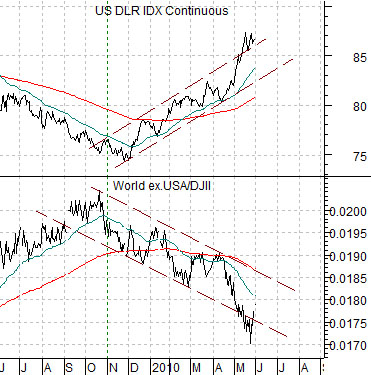
We are going to return to an argument that has graced these pages on many occasions since at least 2007. Probably even earlier. At top right is a chart comparison between the U.S. Dollar Index (DXY) futures and the ratio between the Morgan Stanley World ex.USA Index divided by the Dow Jones Industrial Index.
The World ex. USA/DJII ratio represents ‘everything else’ compared to U.S. large caps. When the dollar is trending lower money is moving away from the U.S. markets in search of better growth prospects abroad. One might argue that this is a result of positive growth in the Asian, Latin, emerging markets, and commodity themes or, perhaps, simply the result of the U.S. large caps reaching valuation levels in the late 1990’s that were… excessive. One might argue that money has been chasing growth or, conversely, that money has created growth. Either way a weak dollar goes with a rising ‘everything else’ compared to U.S. large caps ratio.
The base argument was that when the dollar turned higher- as has been the case since November of 2009- the U.S. large caps would outperform. Which, of course, it exactly what happened.
So… with Europe in turmoil, Chinese growth slowing, tensions mounting in the Middle East, and Australia tightening credit and taxing mining companies… money is returning to the dollar. At the same time many investors are convinced that U.S. large cap stocks must decline in the face of such obvious concerns and, similar to 2008, that may prove to be the case, but in truth it is only one of a couple of obvious outcomes.
The chart makes the point that as the dollar rises the stocks represented by the Dow Jones Industrial Index will rise relative to ‘everything else’. The chart does not argue that the DJII has to rise on an absolute basis but, in fact, that has been our expectation.
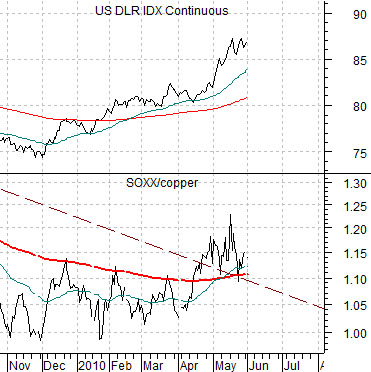
Below we show the DXY futures and the ratio between the Philadelphia Semiconductor Index (SOX) and copper futures.
When the dollar rises tech tends to outperform base metals. While the trend began to gain traction through April the indiscriminate sell off through May knocked it lower once again. With the dollar still pushing one has to like U.S. large caps along with the more cyclically oriented tech names.
Equity/Bond Markets
June 1 (Bloomberg) — U.S. stocks fluctuated as higher- than-estimated growth in construction spending and manufacturing offset a drop in energy shares.
June 1 (Bloomberg) — Stocks and oil dropped, while the dollar and Treasuries rose, as a report that Lebanon fired on Israeli warplanes spurred concern tensions in the Middle East are escalating. Energy companies led declines in equities after BP Plc failed to halt the biggest oil spill in U.S. history.
The first Bloomberg comment above was captured midway through the trading session while the second was published after the close. In early trading energy sector weakness was being offset by strength in the large caps but late in the day index futures selling pushed the entire market into the red.
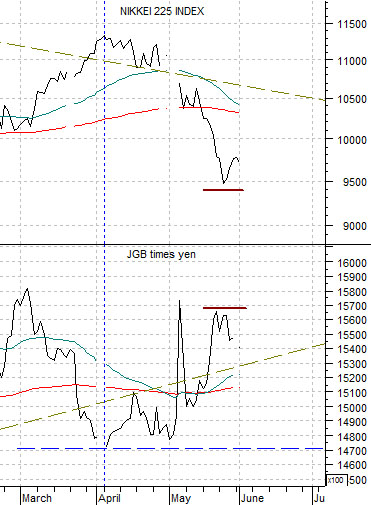
Below is a chart comparison between Japan’s Nikkei 225 Index and the product of combination of the Japanese 10-year (JGB) bond futures and the Japanese yen.
The premise is that the Nikkei is the mirror image of the JGBs and yen. Put another way… the Japanese stock market can rise IF the yen and Japanese bond market are weaker.
Our view is that there is a surplus of two things at the moment- concern and money. When ‘concern’ increases money heads to cash, bonds, gold, the dollar, and the yen. Given that there appears to be no shortage of money this leads to big swings within the markets as money moves from here to there and then back to here and then over to there. This is not a cash-starved inverted yield curve situation; instead it is the kind of market that is doing its best to push cash towards risk.
Our next thought is that the markets tend to create their own reality. Rising oil prices into 2008, for example, convinced almost everyone that there was a shortage of crude oil. Our view was that there isn’t a shortage as long as you are able to buy as much as you want of a product at any time.
In any event… we show gold futures prices in terms of the euro on the following page. As gold in terms of the euro drove relentlessly towards 1000 the markets created a reality that included potential crisis (gold prices) and collapsing Eurozone strength (weak euro). Yet the perception of reality which most days becomes reality would change completely the moment that the gold/euro ratio began to crumble.
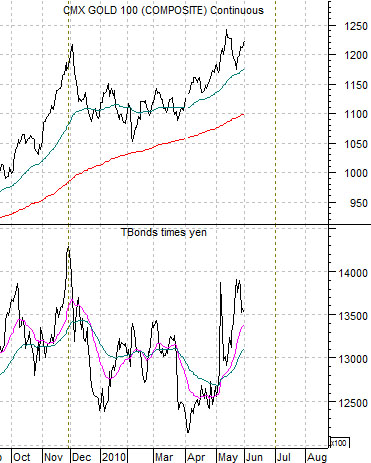
At bottom is a comparison between gold futures and the product of the U.S. 30-year T-Bond futures times the Japanese yen futures.
The idea is that gold, the TBonds, and the yen are all destinations for capital fleeing risk. If gold prices are truly moving higher as the result of an excess of ‘concern’ then we would expect to see the trend confirmed by an upward spike in the TBonds times yen combination. This is basically the same as the JGB times yen product shown at top right.
The point? The Nikkei is on one side of the equation with gold prices on the other. New highs for gold should go with new lows for the Nikkei. At present both markets are holding the extremes reached last month suggesting at least the potential for a near-term bullish outcome for risk-based asset prices.