One of our favorite financial markets quotes come from the legendary Warren Buffett when he stated that you don’t know who is swimming naked until the tide goes out. In a world leaping from crisis to crisis this is a rather important concept.
Our view is that crises are the end results of one-sided capital flows. In other words crises do not create or initiate a trend but instead are often what marks the end of a trend.
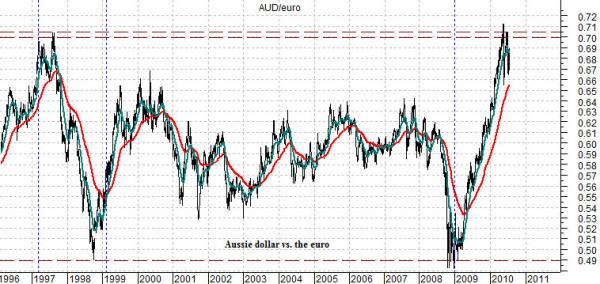
To explain… we have included below a chart of the cross rate between the Australian dollar (AUD) futures and the euro. We are going to build upon this argument on the following page as we attempt to add some context to the current situation.
The idea here is that the cross rate between the AUD and euro tends to trend back and forth between a low of around .50 and a high close to .70.
The Aussie dollar relates to two themes- Asian growth and commodity prices. When the AUD is trending higher it means that the underlying trend within the markets is focusing on positive Asian growth. This creates a concurrent rising trend for energy and base metals prices.
Conversely when the AUD/euro is trending lower the markets are working on a theme that involves slower Asian growth and weaker energy and base metals prices.
The markets slipped into crisis in the late summer of 1998 as the economies of countries like Singapore, Thailand, Indonesia, Malaysia, and the Philippines slipped under water. Yet the crisis within the markets did not occur right out of the blue but instead was the result of more than a year and a half of AUD/euro weakness as capital moved away from the Asian growth theme.
If the Asian crisis revealed which countries were swimming naked following the exit of capital then the recent Eurozone crisis was similar in many respects. The powerful rising trend for the AUD/euro between late 2008 and mid-2010 was almost the exact opposite of the trend that ultimately led to the Asian crisis. In this instance we discovered which European countries were most at risk following a year and a half of capital outflows.
Equity/Bond Markets
We have shown the AUD/euro cross rate on a number of occasions over the past few months. Today we wish to add to the argument somewhat.
Our premise is that 1998’s Asian crisis was the end result of a very weak AUD/euro cross rate. The cross rate represents the flow of money towards the Asian growth theme and the Asian growth theme sets the tone for the trend for energy and base metals prices. In other words we are hopping and skipping from the AUD/euro over the crude oil and copper futures prices.
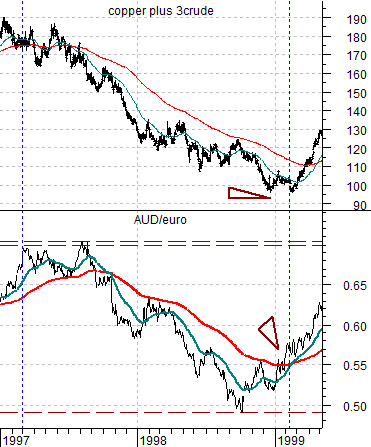
At top right is a comparison between the AUD/euro and the sum of copper and crude oil futures from 1997 into 1999.
The first point is that the trends are broadly similar. Not every day or, perhaps, every month but over time the trend for the Aussie dollar relative to the euro is fairly close to the trend for copper and crude oil futures.
The second point is that 1998’s Asian crisis occurred at the low point for the AUD/euro. It did not coincide with the low point for copper and crude oil futures. In fact it is probably fair to write that the recovery following the crisis began in earnest once the AUD/euro began to rise during the fourth quarter of 1999.
The third point is a spin off of the second point. The argument is that the AUD/euro bottomed and turned higher several months ahead of copper and crude oil futures. The start of a sustained recovery in energy and metals prices- a trend that dominated the markets for much of the next decade- began right around the time when the 50-day e.m.a. line for the AUD/euro crossed up through the 200-day e.m.a. in February of 1999.
So… our thought was that 2010 was really quite similar to 1998- 99. Only in reverse.
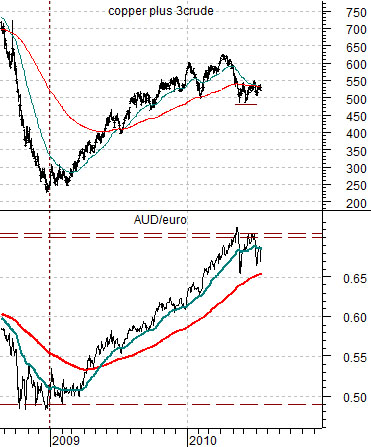
Below right we show the AUD/euro cross rate and the sum of copper and crude oil futures from the current time period.
Once again we can see that the trends are fairly similar as both bottomed in late 2008 and pushed higher into 2010.
If the Asian crisis roiled the markets around the time when the AUD/euro bottomed in 1998 then the timing of the Eurozone crisis during the second quarter of 2010 seems appropriate given the trading range between .50 and .70 for the AUD/euro.
If strength in the AUD/euro in late 1998 marked the end of the Asian crisis the weakness in the AUD/euro this year should indicate the end of the Eurozone crisis.
If the AUD/euro led crude oil and copper futures into 1999 then we could see weakness in the cross rate leading energy and base metal prices through the second half of 2010.
If the bottom for copper and crude oil in 1999 was reached when the moving average lines ‘crossed’ for the AUD/euro then we could still be months away from real weakness in commodity prices as the AUD/euro works far enough back below .65 to pull the 50-day e.m.a. line back through the 200-day.