We have been arguing for some time that the tail end of 2010 would include a strong cyclical push. Our sense is that over the coming quarter we will see the U.S. Dollar Index drift down towards roughly 75, 10-year yields moving back up towards 4%, while the S&P 500 Index runs potentially as high as 1400. Shorter-term the SPX looks like 1180 and then 1230 but in our more optimistic moments something in the vicinity of 1400 seems possible.
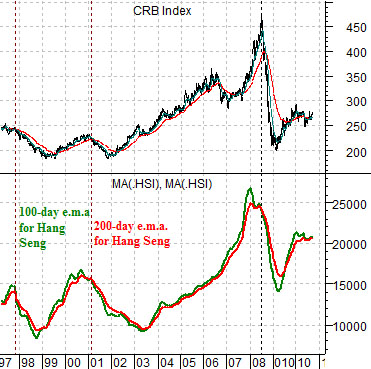
Below is a comparative view of the CRB Index and the Hang Seng Index from 1997 to the present day. The Hang Seng Index is shown using two moving average lines (200-day e.m.a. in red, 100-day e.m.a. in green).
The argument is that as long as the 100-day is above the 200-day (i.e. green above red) the trend is positive and if the trend is positive for the Hang Seng then it is positive for the CRB Index.
The moving average lines have ‘crossed’ to the down side on three occasions since the mid-1990’s. This took place in 1997, early 2001, and again in mid-2008 marking the start of three bearish trend for the commodities markets.
We have fixated on the converging of the moving average line in recent months while arguing that strength in the Hang Seng Index will be required to keep the cyclical recovery intact. We will return to this topic on today’s third page.
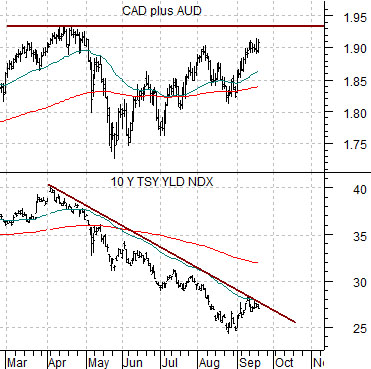
Next is a comparison between the sum of the Canadian and Australian (CAD plus AUD) dollar futures and 10-year U.S. Treasury yields.
By and large the CAD and AUD have trended with copper and the Hang Seng Index while 10-year yields have declined on weaker U.S. growth and pressures on the tech sector. To the extent that cyclical is cyclical… strength in the commodity currencies should ultimately lead to a recovery in the large cap tech names, the major banks, and then U.S. housing prices. As the CAD and AUD push back towards the April highs the trend for long-term Treasury yields should bottom, settle, and then swing back to the upside. At present we appear to have passed the ‘bottoming’ stage after yields touched support at 2.5% and are now in between ‘settling’ and ‘rising’ as we move towards the end of the current quarter.
Equity/Bond Markets
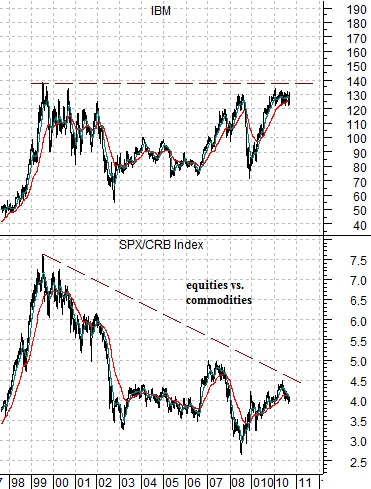
With IBM’s stock price pushing back into the low 130’s yesterday our thoughts turned once again to what it might mean if a cyclical recovery manages to push its share price on to new highs this year.
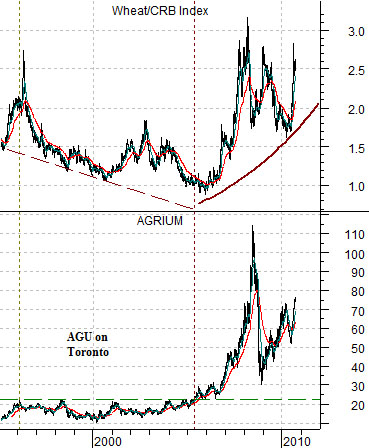
Below is a comparison between Agrium (AGU in both Toronto and New York. We are using the Cdn dollar price for this chart although the U.S. dollar chart is almost identical) and the ratio between wheat futures and the CRB Index.
AGU consolidated below the low 20’s for close to a decade between 1995 and 2005. From an intermarket point of view this made sense as wheat futures prices languished relative to the broad commodity index.
When AGU finally broke to new highs in 2005 grains prices were still quite weak. Corn futures, for example, remained near the lows through 2005 and didn’t begin to march seriously higher until the tail end of 2006. Our argument at the time was that the grains would not begin to run upwards until copper futures had reached some kind of cycle price peak.
With the benefit of hindsight copper prices reached a top in the spring of 2006 followed by a rotation within the commodities markets over to the grains. Yet the share price of AGU breaking to new highs in 2005 indicated that a major paradigm shift was taking place in the agriculture sector months before it showed up in earnest through rising grains prices.
Our point is that after a decade of consolidation the break to new highs by AGU in 2005 was ‘important’. The market was saying that something was changing even if months and months had to go by before it became apparent what the change actually was.
Further below is a comparison between IBM and the ratio between the S&P 500 Index and the CRB Index.
IBM’s share price has been consolidating for more than a decade below the highs set in 1999. We have focused on IBM in past issues because it represents one of the stronger examples of large-cap U.S. stocks consolidating below the late-1990’s price highs.
Our view is that IBM above resistance between 130 and 140 represents yet another paradigm shift. Our view is that it should mark the end or, perhaps, the beginning of the end of the downward tilt of the SPX/CRB Index ratio that has dominated trading within the markets through the most recent decade.
To us a falling SPX/CRB Index ratio represents a number of themes. It favors smaller cap, non-U.S., foreign, emerging, Asian, Latin, commodity, basic materials, producer, and infrastructure. It pushes money away from the U.S. dollar, reflects limited growth opportunities for large cap names, and leads to companies like Microsoft and Intel piling up cash. Years from now we may look back at this time and mutter that we should have known that something was changing as soon as Cisco relented and announced that it was going to pay a dividend. In our less lucid moments we actually expect that companies like Microsoft will be split into pieces in a manner reminiscent of ATT and the Baby Bells back in 1984. Yet… for the current trend to end and a new trend to begin… something has to happen and near the top of the list of ‘somethings’ is a break to new highs for IBM. Whether this proves to be as important as the break out by Agrium in 2005 remains to be seen.