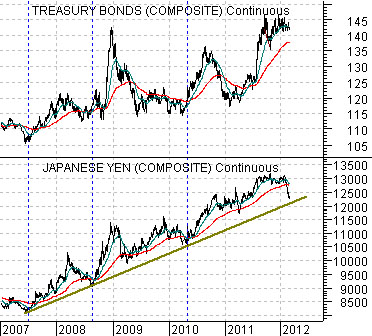
The argument yesterday was that weakness in the Japanese yen is bullish until it approaches the rising trend line. If it breaks the trend line the outcome would be exceptionally bullish but… if it holds support and then swings higher along with bond prices then we may be heading back down the rabbit hole.
Why and, perhaps more importantly, why now? (Reuters) – The euro fell on Friday, keeping it on track for its worst week since mid-December after Spain set a softer 2012 deficit target than one agreed upon with the euro zone in a challenge to the European Union’s new fiscal pact.
The reality is that the markets have shifted from one crisis into another since 2007. The driver behind another decline could be a ‘pressure shift’ from Greece over to something like Spain.
First is a comparison between the U.S. 30-year T-Bond futures and the Japanese yen futures from 2007 to the present day. The chart shows that each time the yen has declined to the support line the markets have moved into a state of crisis that has led to sharply escalating long-term Treasury prices.
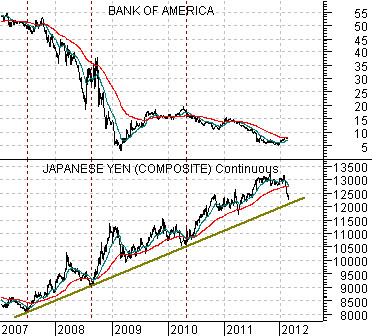
Next is a comparison between the share price of Bank of America (BAC) and the Japanese yen futures.
The Japanese yen futures fell below the 200-day e.m.a line and then swung back up through the line in 2007, 2008, and 2010. Each instance marked the return of a state of financial markets crisis that went broadly with extreme pressure for the financial sector. The offset to strength in the yen, bonds, and gold was rather extreme weakness for the share prices of the banking stocks.
We are not arguing that the markets are on the verge of yet another collapse but instead are attempting to play a little defense. We have been championing the bullish outcome for months so this might be an appropriate point in time to take a step back to evaluate where things stand.
Equity/Bond Markets
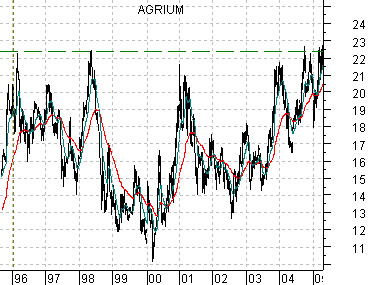
We are going to approach our argument from a rather strange direction today. Without further explanation… below is a chart of Agrium (AGU) from late 1995 into 2005.
Over a period extending more than nine years the share price of Agrium traded up to and then down from roughly the 22 level. Each time the stock approached the highs the feeling that ‘this time was different’ quickly faded away.
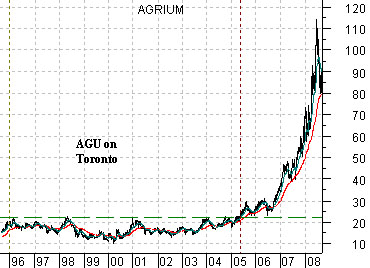
Next is the same chart extended through into 2008. Notice that in 2005- more than a year before grains prices began to soar- the stock price of AGU broke up through the 22 level before running out of momentum around 30. When grains prices finally kicked into gear AGU exploded into a parabolic rise that would break the 110 level in 2008.
The point? The problem with long-term support and resistance levels is that, more often than not, they tend to hold. Agrium was a ‘sell’ each time it moved above 21 for years but when it moved through that range- even though the reasons for the price strength were not obvious at the time- the markets were telling those who would ‘listen’ that something of significance had changed.
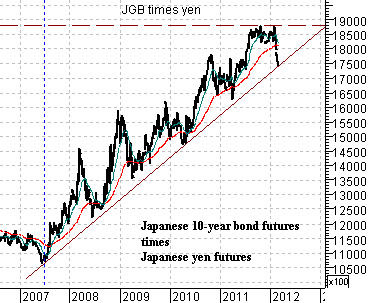
Below is a chart of the combination of the Japanese 10-year (JGB) bond futures times the Japanese yen futures.
As mentioned on today’s first page the rising trend for this combination reflects the broad trend for crisis and financial markets pressure. Each test of the support line has invariably led into a bearish equity markets reaction.
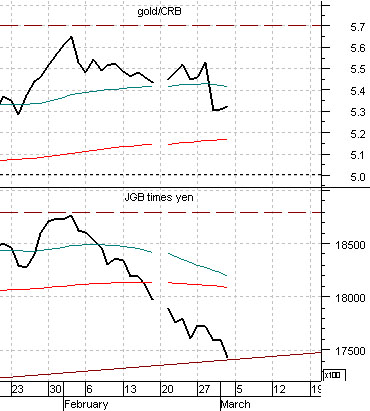
Last we show a short-term view of the JGBs times the yen along with the ratio of gold to the CRB Index. Our argument has been that the upward trend for bond prices and the Japanese yen has gone with concurrent upward pressure for gold prices.
So… the point is that while we can be hopeful that this time is different as the JGBs times the yen break support to confirm the extension of the bullish recovery trend… a case can be made that nothing has changed as of yet.