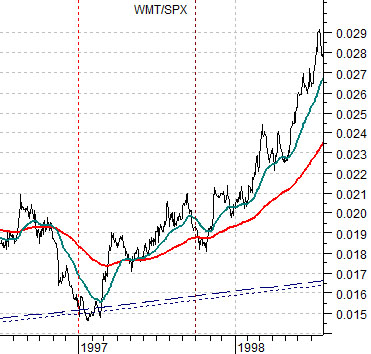
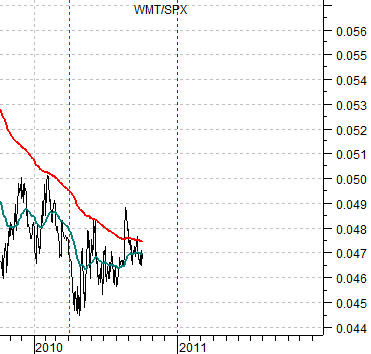
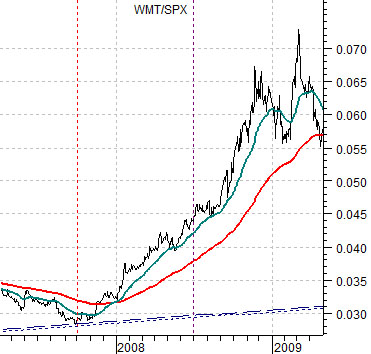
We have included three charts of the ratio between Wal Mart (WMT) and the S&P 500 Index (SPX). The chart at top right shows the time period between 1996 and 1998, the chart below right from 2007 into 2009, and the chart below from late 2009.
One interesting feature of the markets is the tendency for the share price of WMT to start to gain relative strength as economic activity fades. As opposed to many of the chart presentations that we produce we suspect that this one actually makes intuitive sense.
In 1997 the WMT/SPX ratio turned higher. Nine months later the Hang Seng Index crashed. In the autumn of 2007 the ratio turned upwards once again and nine months later the commodity markets (and most everything else) collapse.
The problem at present is that while the ratio has been rising it has done so in a tepid sort of way. A case can be made that we will see some kind of growth break down in early 2011 but between now and then we would expect to see the WMT/SPX ratio substantially stronger. This is going to be one of the ‘keys’ that we will be following through the balance of this quarter.
Equity/Bond Markets
Oct. 6 (Bloomberg) — Nobel Prize-winning economist Joseph Stiglitz said the Federal Reserve’s policy of cutting interest rates to a record low has had repercussions worldwide, including currency misalignments and the risk of asset price bubbles.
Good. It has been a few years since our last asset price bubble. From the long side they are certainly more fun than the post-bubble collapse.
The argument is that the rising equity markets trend will likely continue as long as the U.S. dollar is trending lower. In fact our sense is that one country after another will be forced to follow Japan’s lead and ease credit in the hopes of cooling speculative currency strength.
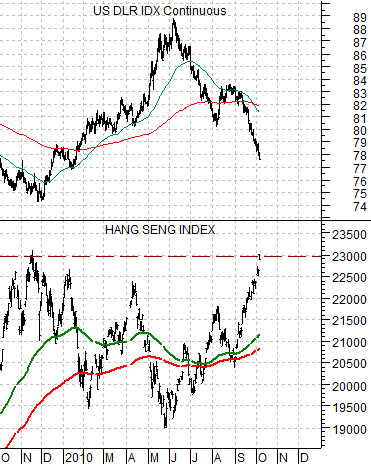
At top right is a comparison between the U.S. Dollar Index (DXY) futures and the Hang Seng Index from Hong Kong. The comparison suggests that the Hang Seng is being driven higher as the dollar declines.
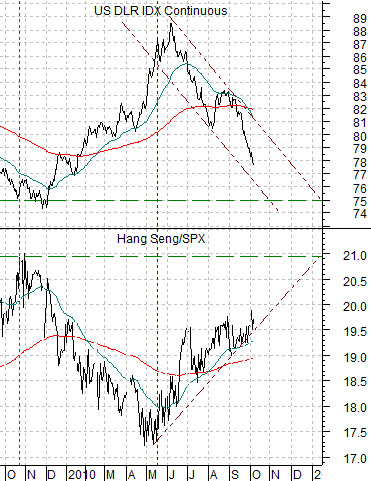
Below right we show the DXY futures once again along with a chart of the ratio between the Hang Seng Index and S&P 500 Index.
While dollar weakness may be supporting the SPX the point is that the Hang Seng Index is leading to the upside. From May through trading yesterday the dollar’s trend was lower with first support due some where around 75.
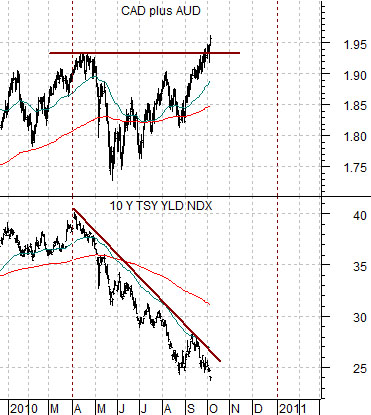
Below is a comparison between 10-year Treasury yields and the sum of the Canadian dollar (CAD) and Australian dollar (AUD) futures.
The argument here is that the bond market is usually ‘right’ and it says that growth is slowing. Often there is a 9-month lag between initial indications of weakness and the collapse of a variety of cyclical markets. In other words… we are still concerned about how bad things might look during the first quarter of 2011.