We have generally stuck with arguments based on the glass being half full but we might as well show one perspective that allows for a bearish resolution over the next quarter or so.
The idea comes from our ‘decade thesis’. The thesis suggests that while the sectors involved tend to change the trends tend to repeat.
In any event… commodity prices peaked on a relative basis in 1980 with the Nikkei topping out in 1990 and the Nasdaq ten years later in 2000. After 20 years of weakness the commodity sector returned to dominance around the end of 2001. If the pattern persists the two sectors that have truly under performed for the last two decades- Japan and the airlines- should do quite nicely over the next ten years.
If the Nikkei and Airline Index (XAL) today are similar to the CRB Index back in 2001 then we should be able to compare the trends using charts offset by 10 years.
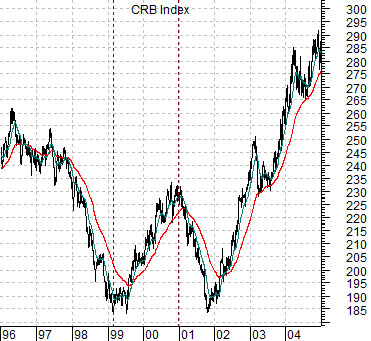
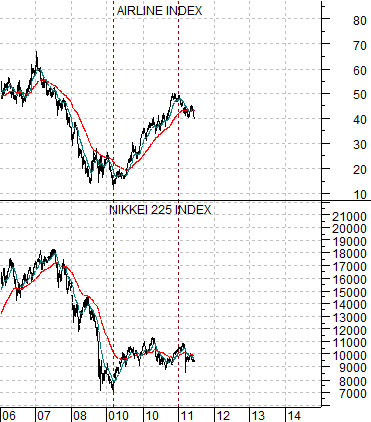
Below is a chart of the CRB Index from 1996 through 2004. Below right is the Nikkei 225 Index and the Airline Index from 2006 to the present time frame.
Using this perspective the argument seems to have a certain amount of validity. The CRB Index was very weak between 1997 and 1998 while the Nikkei and XAL trended lower during 2007 and 2008.
The CRB Index pivoted higher in March of 1999 while the Nikkei and XAL moved upwards in March of 2009. The rising trend for the CRB Index from 1999 through 2000 shows up through similar strength in Japan and the airlines between early 2009 and the end of 2010.
The point is that if we take the comparison literally then the cyclical bounce that began in early 2009 would begin to falter at the start of 2011 with a negative trend running into the final quarter of the year. The good news, however, would be that once the 2011 pressures abate prices should swing sharply higher.
The comparison argues that the bullish trend began in early 2009 but that this year’s downward pressure could continue for another quarter or two before prices snap upwards to return to the rising trend. A very bullish longer-term argument sprinkled with a considerable amount of short-term uncertainty.
Equity/Bond Markets
With long-term bond prices showing weakness yesterday we thought that we would take one more swipe at the Panasonic argument that we introduced in yesterday’s issue.
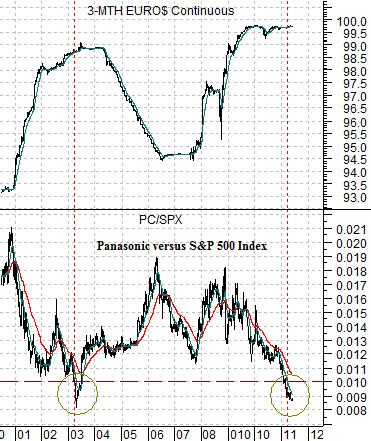
The chart below compares the Panasonic/S&P 500 Index ratio and 3-month eurodollar futures prices from 2000 to the present day.
A ratio level of .10 is an arbitrary choice. A slightly higher number might work better but this is probably close enough for our purposes. The idea is that the PC/SPX ratio has only fallen below .10 on two occasions. The first instance was back in 2003 well ahead of the start of rising U.S. short-term yields and just in front of the upward launch by the ‘laggard’ equity markets sectors. To put this into some form of perspective in April of 2003 PC was trading in the 7’s. Three years later it touched 25. In April of 2003 the share price of Nomura (NMR) was in the 9’s and six months later it had moved above 18.
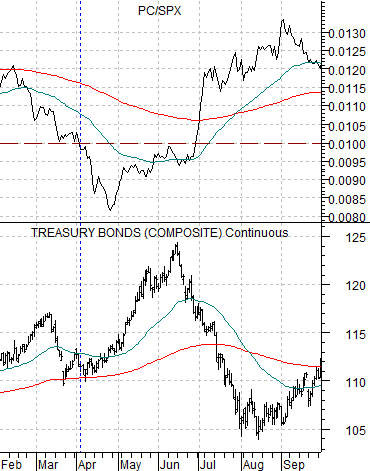
The chart below compares the PC/SPX ratio with the U.S. 30-year T-Bond futures from 2003. The argument is that on the last decline for the PC/SPX ratio between April into June of that year the TBond futures jumped higher. The June price peak marked a high point that would hold all the way into 2008.
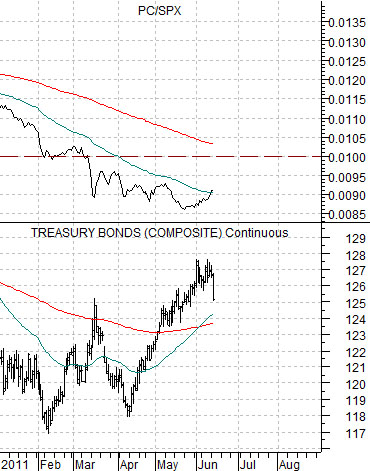
Below is the current situation. Our thought was that the break by the PC/SPX ratio below .10 this year concurrent with a strong bond market… put the present situation in line with what was happening in the markets during the second quarter of 2003. If bond prices were to pivot back to the down side then… more than 2 years after the U.S. equity markets began to recover post-2008 we could be looking at the very start of the rally for the laggard cyclicals.