We are going to return to an argument that we made on more than a few occasions earlier this year. The idea originated from the way the markets resolved through the equity bear market bottom back in 1982.
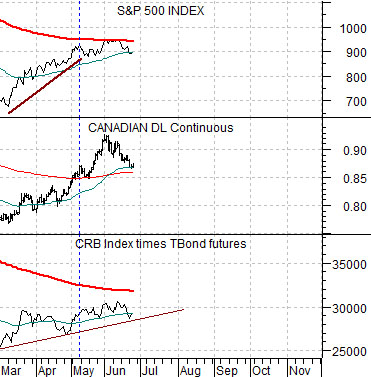
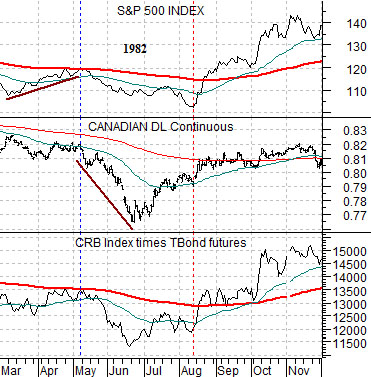
The chart at right compares the S&P 500 Index (SPX) with the Canadian dollar (CAD) futures and the combination of the CRB Index (commodity prices) multiplied by the U.S. 30-year T-Bond futures (bonds).
The equity market is one part ‘financial’ and one part ‘growth’. Stock prices are elevated by falling interest rates and higher long-term bond prices and helped by the kind of improving economic growth that lifts raw materials prices. Weakness in commodity prices often drives bond prices higher so the argument was that when commodities ‘times’ bonds began to recover the stock market would rally as well.
The CRB Index times TBonds combination pushed up to the 200-day e.m.a. line in early May of 1982 with the commodity price-sensitive Canadian dollar showing a certain amount of strength against the U.S. dollar. The final sell off for the equity markets occurred between May and August led by weakness in the Cdn dollar and a decline in ‘commodities times bonds’. Once the Cdn dollar made a bottom in June and began to recover the equity ‘bear’ was in its final stages. By August the ‘commodities times bonds’ combination pushed up through its moving average line followed closely by the S&P 500 Index.
Our thought was that 2009 could prove to be somewhat similar. We argued that the SPX would stage a 2-month rally from March into May before being pulled lower by Canadian dollar and commodity price weakness.
We got the first part right but instead of declining the commodity currencies accelerated to the upside into the end of May.
Our basic view, however, has not changed. The SPX has struggled through June as the Canadian dollar has tracked lower but we have yet to see the kind of commodity price weakness necessary to break the rising trend line under the CRB Index times TBonds combination. If this were to happen as we move into the third quarter we could still see a second round of stock market weakness through the month of July culminating in a more lasting rally phase later this summer.
Equity/Bond Markets
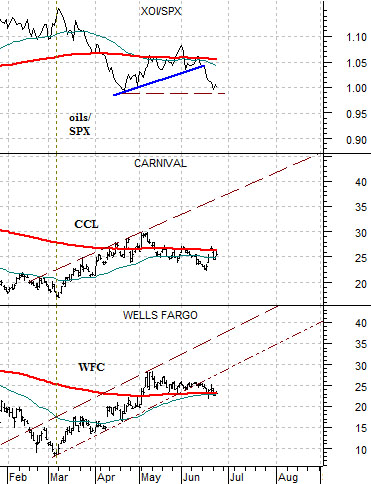
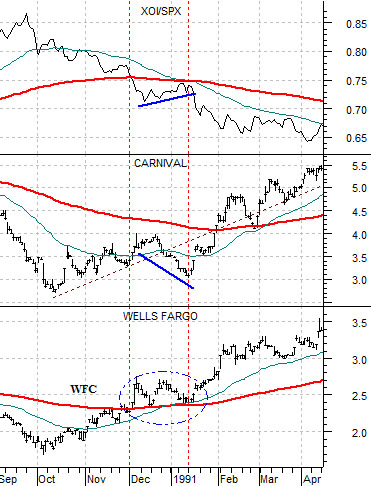
Below we return to the comparison between the Amex Oil Index/S&P 500 Index ratio (XOI/SPX) and the share prices of Carnival Cruise Lines (CCL) and Wells Fargo (WFC). The chart shows the time period from September of 1990 into April of 1991. Below right we feature the same comparison from the present day.
The argument was- once again- that a rising trend for WFC and CCL should begin once the XOI/SPX ratio reached a peak. This happened in late September of 1990 with the recovery stalling somewhat towards the end of the year as the XOI/SPX ratio back up towards the moving average line.
The trend this year has been quite similar as the XOI/SPX ratio reached a peak in early March. The ratio declined below its moving average line before pushing back up to it through the month of May. Our sense is that it might take a clean break to new lows by the ratio nicely below 1:1 before the share prices of CCL and WFC swing back up to their rising trend lines.
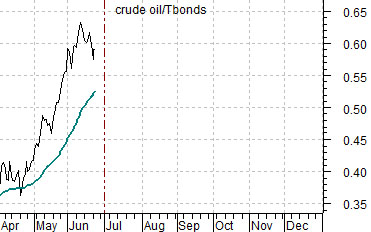
The comparison to 1990 depends on at least one other factor- the ratio between oil prices and bond prices. Below we show the crude oil/U.S. 30-year T-Bond futures ratios from 1990 and 2009.
One difference between the current cycle and 1990 is the position of this ratio. In 1990 it reached a peak through the end of the third quarter which led directly into the end of the equity ‘bear’. In 2009 the ratio is pushing upwards into the end of the current quarter which simply means that it has diverged somewhat from the XOI/SPX ratio. The point? The argument is a bit frayed and stressed but it has served as well to this juncture so we will continue to show it on a regular basis.