The entire year has been little more than one crisis after another. From a glass-is-half-full perspective the fact that asset prices have remained stronger for so long is borderline miraculous given the severity of the issues that the markets have faced over the past seven months.
Our view is that the factor that has caused the greatest amount of stress is the rise in energy prices. Specifically Brent crude and gasoline futures. Our view is that the reason the trend feels so negative at present is that the risk-based commodity theme has run face first into the reality of what happens to industrial and consumer demand when energy prices rise too quickly.
On the other hand… there is little that has happened to date that can not be remedied through a good and thorough pummeling of energy prices. That might well be the good news.
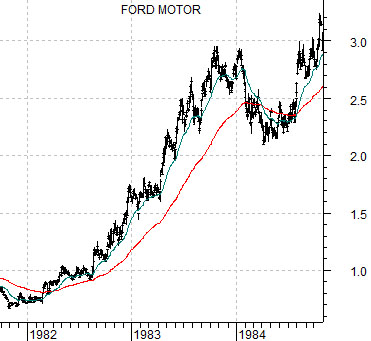
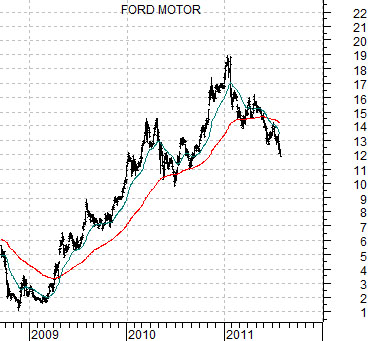
As far back as 2008 we argued that the recovery should look very similar to the markets post-1981. Our view was predicated on the idea that the recovery would be led by energy ‘user’ themes. On occasion we have shown the ratio between the share price of Ford (F) and gasoline futures prices but today we are going to simplify the argument somewhat by featuring a comparison between Ford today and Ford from 1981 through 1984.
The share price of Ford bottomed in the fourth quarter of 1981 and rose steadily through into the end of 1983. The first seven months of 1984 represented a broad correction for the bull market with the S&P 500 Index actually declining by just enough to technically be called a ‘bear market’.
When we line up the chart of Ford today with the 1981- 84 experience we can see that the trends are actually very similar. One could argue that what we have been wading through this year is merely a consolidation within a rising trend with a return to new highs imminent as we push on deeper into this year. To get from here to there, however, we need to shake off those stresses and pressures that have been working to pull asset prices lower. We will show what happened in 1984 and offer our take on 2011’s problems on the following page.
Equity/Bond Markets
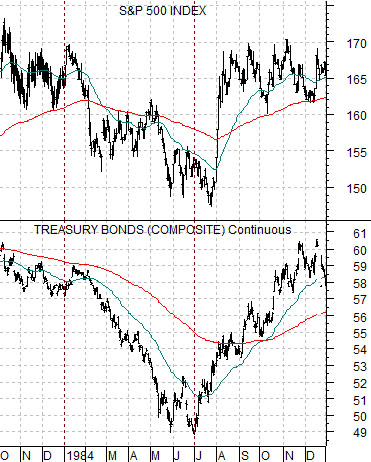
Below is a chart comparison between the S&P 500 Index and the U.S. 30-year T-Bond futures from the autumn of 1983 through the end of 1984.
As shown on the first page the markets corrected the initial post-1981 excesses during 1984. The equity bull market continued through the ‘crash’ in 1987 and into the pre-recession highs of 1990.
The point is that a recovering trend is always going to go through periods of consolidation. The bigger issue is whether it makes sense to abandon the long side entirely or even get short at current levels.
Our problem with this can be seen on the charts at right. The SPX declined with the bond market from January through into very late July in 1984. Falling bonds led to falling stocks.
Notice, however, that the bond market stopped declining around the end of the second quarter in 1984. Once the bond market began to bounce in price the stock market dipped to new lows before turning higher.
Of course ‘turning higher’ is something of an understatement given that the SPX made back almost all of the year’s losses over four trading days in early August.
The question today is… what is pressuring the stock market lower? One answer would be rising gold, Swiss franc, Japanese yen, and bond prices. If this is truly the answer then being in cash or short the markets makes sense as long as gold, the franc, yen, and long-term Treasury prices are still making new daily highs. Fair enough.
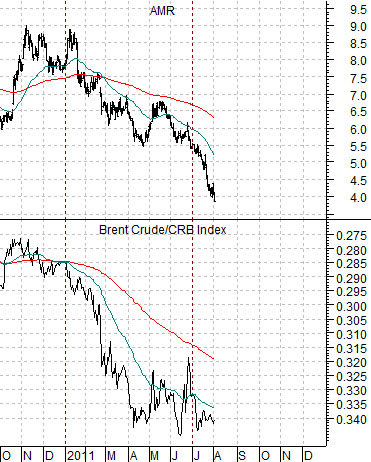
However, our view is that this year’s negative pressures have emanated in large part by a rise too far and too fast for energy prices so below right we have constructed a comparison to show this particular perspective.
The chart compares the share price of AMR with an upside down chart of the ratio between Brent crude oil and the CRB Index.
We turned the Brent/CRB Index upside down so that it would trend in the same direction as the 1984 TBond futures chart. It might help to think of a falling ratio as an increase in the negative impact of rising energy prices.
The case that we are attempting to make is that while the SPX did not bottom until some time after the bond market reached its lows in 1984 it became increasingly risky to be out of the market or short the market once bond prices began to rise in June of that year.
The same may be true at present. Brent crude oil futures reached their most bearish and negative levels in June of this year so while the kind of pressure that has been moving AMR’s share price lower may continue… one only has to look back to early August of 1984 to see how fast prices can rise once the pressures disappear. If we are correct that energy prices are the problem then the solution, naturally enough, is a fairly substantial decline in Brent and gasoline futures prices.