We are going to take another run at the basic argument that we put forth in yesterday’s issue.
The argument was that there was a certain similarity between the market cycles into 1987 and that of the current time period. Whether this sequence will lead to the same kind of outcome is, of course, open to question.
To some extent we are comparing apples to oranges or, perhaps, apples to wrenches but the idea begins with the collapse in crude oil futures prices at the end of 1985.
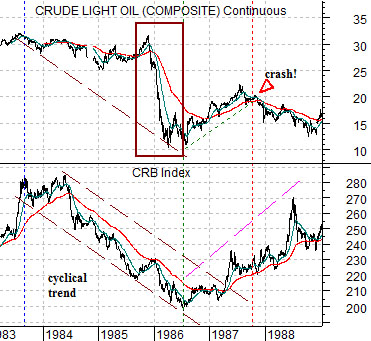
The chart below compares crude oil futures with the CRB Index from 1983 through 1988. The CRB Index turned lower through 1984 even as crude oil prices remained near the highs. The trend for commodity prices was lower for close to two years until energy prices finally collapsed into the spring of 1986.
Lower oil prices were met with a soaring bond market as interest rates dropped rapidly. As the cyclical trend turned back to positive in 1986 the combination of low interest rates and recovering cyclical growth powered the stock markets higher.
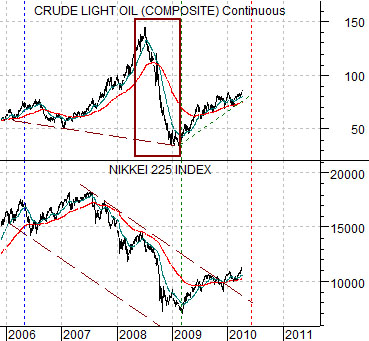
Further below we show crude oil futures and Japan’s Nikkei 225 Index from the current time period.
In terms of apples and oranges we are comparing the downward trend for the Nikkei between 2006 and 2008 with the CRB Index from 1984 and 1985. What makes this somewhat relevant is the collapse for oil futures prices during the second half of 2008.
If the decline in crude oil prices in 2008 was the tail end of a negative cyclical trend dating back to 2006 then the argument would be that the pressures on the Japanese equity market a few years back were in some way similar to the pressure on general commodity prices prior to 1986.
While the comparison might seem somewhat imaginative the reality is that the sharp downward break in oil prices in 2008 did hammer interest rates lower leading into an equally sharp recovery in cyclical growth and asset prices in the face of a return to rising yields.
Equity/Bond Markets
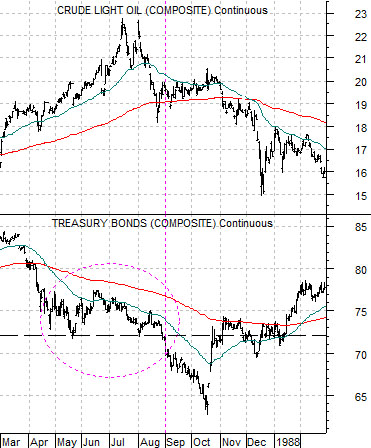
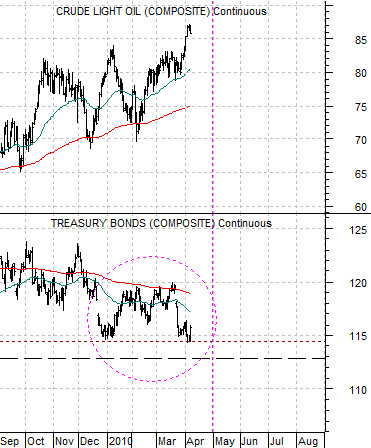
Below are two chart comparisons of crude oil futures and the U.S. 30-year T-Bond futures. The lower chart is from 1987 while the chart below right is from the current time frame.
The stock market ‘crash’ in October of 1987 followed the earlier break below support by the long end of the bond market towards the end of August. As crude oil prices rose to a peak into July the bond market was pressured lower and as the TBonds dropped through support around the 72 level the equity markets began to crack.
The basic argument today is that the TBond futures have declined to the support area between roughly 113 and 115. Yesterday’s robust bond price rally as 10-year yields moved back down from 4.0% suggests that the lows reached by the TBonds in December of 2009 and early April of this year represent key support.
There are a few differences between 1987 and 2010 and given the markets’ propensity to repeat in entirely unexpected ways it is altogether possible that a break down through support by the bond market will lead to a different outcome.
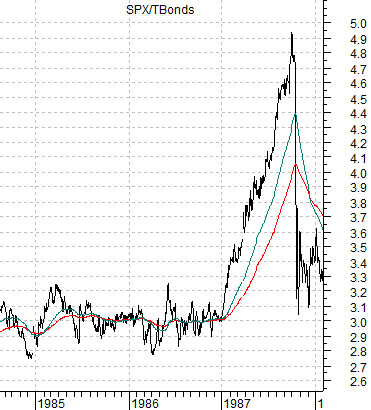
To explain we have included at top right a chart of the ratio between the S&P 500 Index and the U.S. 30-year T-Bond futures from 1984 into early 1988.
The stock market ‘crash’ was largely the result of pressures created as equities rose relative to bonds. The SPX/TBond ratio drove relentlessly higher from January of 1987 into August before collapsing back again in October. While the struggle in 1987 was between equities and bonds the situation in 2010 may be somewhat different. Our challenge over the next few weeks is to try to identify where the pressures exist for the current cycle.
