We have a bewildering list of biases and views with respect to the markets. One of them has to do with 10-year yields being plus or minus 2%.
The argument is that a disinflationary trend involves 10-year yields declining down to 2%. A deflationary trend, on the other hand, kicks in once yields fall below 2%. Recovering from the tractor beam pull of both disinflation and deflation requires confirmation from the bond market through rising interest rates but to escape from deflation yields have to successfully hold above 2%.
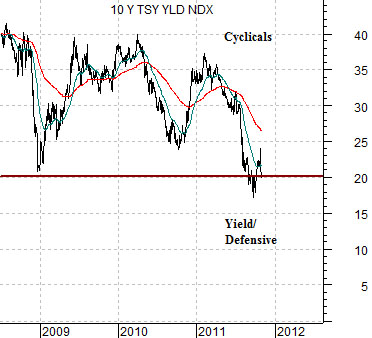
First is a chart of 10-year Treasury yields. We have scaled the chart to make 2.0% (20) something of a mid-point.
The U.S. is flirting with a cross over from disinflation to deflation. With 20 consecutive years of falling real estate prices Japan is well aware of what happens when deflation gains traction so what happens next is going to be very important.
From an investment stand point it is difficult to hold great conviction at this juncture. Our ‘lean’ is towards yields rising up and away from 2.0% with the cyclical trend gaining enough momentum to pull Japanese yields up from 1.0% through 2.0%.
An alternate outcome involves Japan’s deflationary trend overwhelming all efforts to create growth until U.S. yields slide down below the 2.0%. In other words the markets remain in a tug of war between downward asset price pressure exported from Japan and the attempt by the Fed to create enough upward price momentum to pull the economic engine out of the ditch.
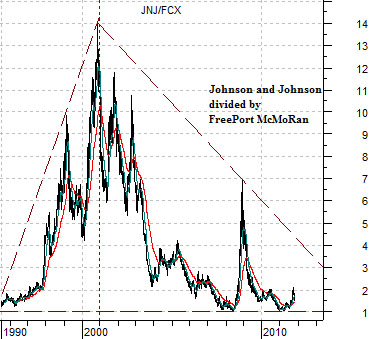
Rising yields favor the economically sensitive sectors. Falling yields favor defensive sectors with safe and secure income streams. If we use something like the ratio between Johnson and Johnson (JNJ) and FreePort McMoRan (FCX) to represent the ‘growth’ versus ‘safety’ we can see that when the share prices converge (creating a ratio of ‘1’) the markets tend to sell growth and buy income.
At the end of 2000 JNJ was 14 times the share price of FCX. In early 2009 it was 7 times. Now it is less than 2 times which seems like an odd point in time for the cyclical trend to turn hard back in favor of the mining stocks.
Equity/Bond Markets
We included the JNJ/FCX ratio on page 1 today because it presents a visual picture that appears to favor a rising ratio. A rising ratio, of course, would go with a downward trend for yields.
The point is that the markets have spent the last decade pushing growth into the commodities and basic materials sectors- creating a downward tilt for the JNJ/FCX ratio- but at the end of the day we find U.S. 10-year yields struggling to remain above 2.0%. After more than 10 years of driving energy, food, and metals prices higher… we find the Fed funds rate at 0% and 10-year yields in danger of signaling deflation. From this perspective it is almost a given that yields have nowhere to go but lower.
On this page we wanted to show an argument that supports a more bullish outcome.
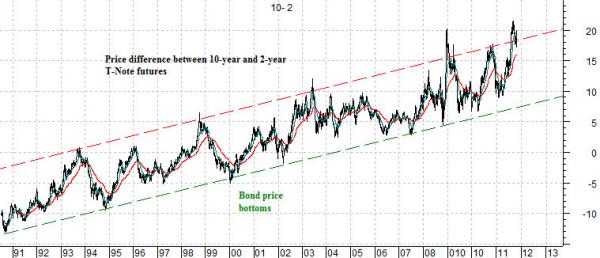
Below is a chart of the price spread or difference between 10-year and 2-year Treasuries. The 10- 2 price spread- as we explained in yesterday’s issue- is just an eccentric way to view the trend for the bond market.
The chart argues that when the spread hits the channel bottom the bond market is at a bottom with long-term yields at a peak. When the spread rises to the channel top it means bond prices are at or near a high with yields at a bottom. Given the history of the spread it does not appear to be too big of a leap to suggest that bond prices are in the vicinity of a major price peak which, in turn, supports the notion that 2% will act as a bottom with the economically sensitive sectors leading the markets to the upside.
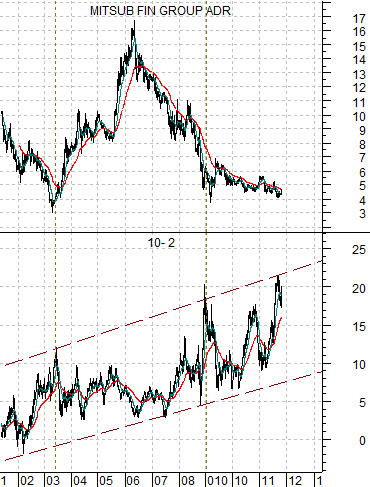
Below is a comparison between the 10- 2 spread and the share price of Japanese bank Mitsubishi UFJ (MTU). MTU represents both the Japanese asset price theme as well as the laggard banks.
The 10- 2 spread peaked in mid-2003 around the low point for MTU. It peaked again in early 2009 just ahead of the bottom for MTU. A peak for this spread should go with the start of a serious recovery for the lagging cyclical sectors.
The problem is… while the 10- 2 spread made a top back in September its trend is almost identical to that of gold prices. We have included this comparison on page 7. To argue that yields will rise from 2.0% becomes somewhat difficult each time gold prices extend the rally to the upside.