One of the challenges that we regularly face is… boredom. The markets are rarely boring even when prices are range trading but we find making the same arguments again and again somewhat tedious. The best example of this might be into 2004 when we had presented views in support of the commodity sector so many times and for so long that we decided to move on to the next thesis. In hindsight that was a particular bad decision.
The good news is that our current argument is somewhat limited in terms of time in that it only extends through the end of next month. The bad news is that we have shown the argument enough times that we almost feel apologetic in running it once again.
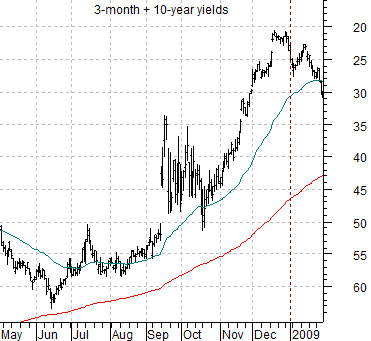
Below is an upside down chart of the sum of 3-month and 10-year Treasury yields from May of 2008 through January of 2009. We have turned yields upside down so that they move with bond prices. In other words a rising line depicts rising prices and falling yields.
The argument is that the cyclical trend lags the bond market by very close to two years. Given that yields collapsed through the second half of 2008 the ‘echo’ from rising bond prices is impacting the cyclical trend this year.
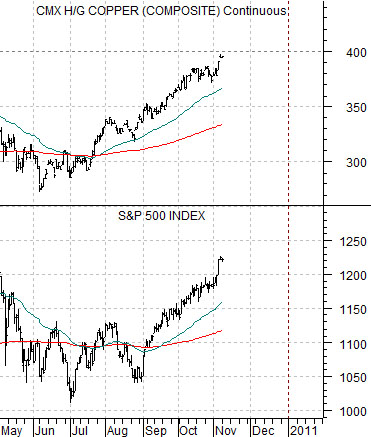
Next we show a chart of copper futures and the S&P 500 Index from the current time frame. The chart begins in May of 2010 so that lines up with the upside down chart of yields from two years previous.
A literal interpretation of the relationship argues that the cyclical trend would correct into mid-year and then swing rather sharply positive. To the extent that this is exactly what has transpired we are drawn to the literal interpretation which means that our expectation is for more of the same into year end.
In issues past we have shown how the equity markets responded to the decline in yields into 1998’s Asian crisis to make the point that the two year lag is not always EXACTLY two years. Still… it makes sense to us to hold as closely to our current thesis as possible until the markets do something to show that the relationship is starting to weaken. For now we are positive on those sectors involved in the cyclical trend including base metals and equities. Yawn.
Equity/Bond Markets
In the weekly Trend and Cycle publication from RBC Capital Markets we noticed the following comment yesterday. Topping the list of frequently asked questions from clients were, “With the market already so overbought how can it go any higher?” and “When will the market pull back so that I can get in?”. Fear and greed are powerful emotions indeed.
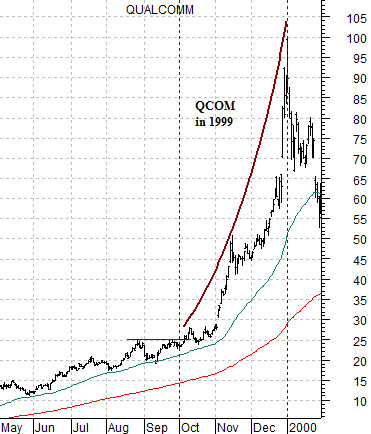
If we toss into the mix the adages that one shouldn’t fight the trend or the Fed… while considering the near proximity of quarter end and year end… the conditions are in place for a rather interesting next few weeks. So interesting in fact that we are encouraged to haul out the 1999 chart of Qualcomm (QCOM) to make our point.
The 1999 QCOM chart is an exaggeration of sorts given that the stock rose from 25 to 100 through the final three months of that year. In the midst of the tech/internet bubble the Fed decided to dump liquidity into the financial system ahead of Y2K… just in case. When momentum combines with liquidity within the context of a fast-approaching year end dead line almost anything can happen.
The chart below features the share price of Qualcomm from May of 1999 through January of 2000. The stock price rose nicely into late August, consolidated into October, and then began to rise parabolically in November. In terms of the questions asked above the answers were that an overbought market can rise far longer than you might think possible and there is no rule or law that we are aware of that mandates that prices have to decline so that timid longs can buy at comfortable levels.
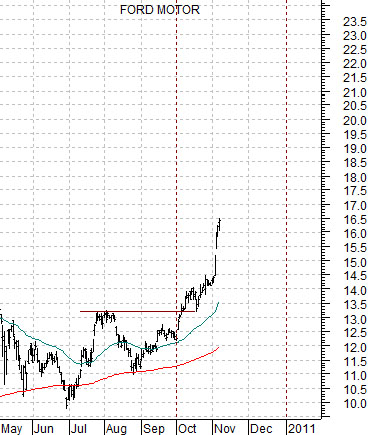
The chart we show next is of Ford (F) from the current time frame. While Ford may or may not serve as a reasonable comparison we have chosen it as an example of how the markets appear to be evolving as we push towards year end.
What we see is a correction from August into October followed by a November price break out. The initial surge as Ford moved from the 13’s into the 16’s appears at least marginally similar to the late-year action in Qualcomm… albeit on a smaller scale.
Our point is not that Ford’s share price is heading for 100 or that it has to go parabolic. Our actual point is that the markets appear to be driving the share prices of almost anything with reasonable earnings momentum higher this month. In 1999 there were quite a number of sectors that actually declined as money shifted towards those themes showing momentum so the argument is that over the next 7 or 8 weeks the trends that we were seeing last week may become even more pronounced. Winners will become stronger while losers may continue to weaken as large pools of money look to maximize quarterly and annual returns in front of the end of the year.
Our final comment is that if this is going to work… much of the action may be compressed into the month of December. Notice, for example, that Qualcomm’s share price rose from 45- 50 up to 100 in the last month of the year only to correct back to 55 in January of 2000 on the way to 25 by mid-summer. Liquidity and momentum should never be confused with actual fundamentals…