Oct. 6 (Bloomberg) — The dollar declined to its lowest level in almost two weeks versus the euro after Australia’s central bank unexpectedly raised interest rates on signs of economic strength, spurring demand for higher-yielding assets.
Goodness… the markets are producing some rather extreme ‘mixed messages’. We will quickly show on this page what we have been looking at (and for) and then attempt to show on the next page how the markets have refused to confirm our views.
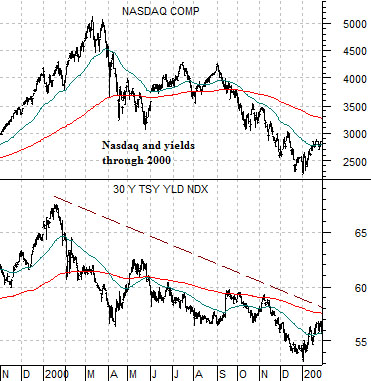
Just below is a comparison between the Nasdaq Composite Index and 30-year Treasury yields from late 1999 through into January of 2001. What we are looking at is the way long-term Treasury yields rose to a peak in early 2000 a few months ahead of the peak for the cyclically-driven ‘tech’ theme.
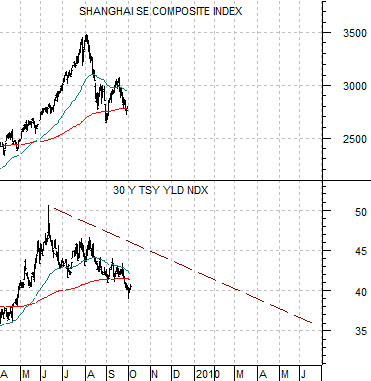
Below is a comparison between the Shanghai Composite Index and 30-year Treasury yields from the current time frame.
In general we try very hard not to argue with the bond market because it is invariably ‘right’. When long-term yields began to rise at the end of 2008 we commented again and again that this meant that cyclical growth was improving. On the other hand when yields reached a top in June and began to slide the argument was that the economic ‘blast’ created by China’s stimulus package, the cash for clunkers program, etc. was losing momentum.
Returning to the charts the point is that in 2000 long-term Treasury yields began to decline a few months ahead of the top for the Nasdaq and almost a year before the Federal Reserve realized that there was a problem. Along the way the Nasdaq staged a number of furious rallies convincing investors that new highs must be right around the corner even as 30-year yields gradually ground lower.
To the extent that yields peaked this year in June followed by a rather convincing top in the Chinese equity market at the start of August our view was that if we place our trust with the bond market… cyclical growth was slowing and when cyclical growth begins to wane the appropriate investment posture is to favor those markets and sectors that tend to do better when the bad news starts to roll in. The dollar, the yen, the bond market, the consumer staples, and pharma stocks appeared to be reasonable choices.
Equity/Bond Markets
The problem with the comparison to 2000 (shown on today’s first page) is that the equity market quite clearly is disagreeing with the bond market. In baseball ties go to the runner and in the markets trend disputes tend to be settled by the bond market. However… without some kind of confirmation we find it difficult to dredge up much in the way of conviction.
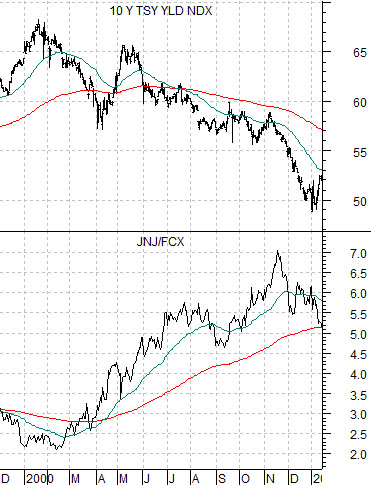
Below is a comparison between 10-year Treasury yields and the ratio between Johnson and Johnson (JNJ) and FreePort McMoRan (FCX) from 2000.
The argument is that even though falling Treasury yields made almost no sense in early 2000 the stock market confirmed the trend change. How was this done? Through a shift in relative strength between JNJ and FCX. As yields started to work lower the JNJ/FCX ratio began to rise.
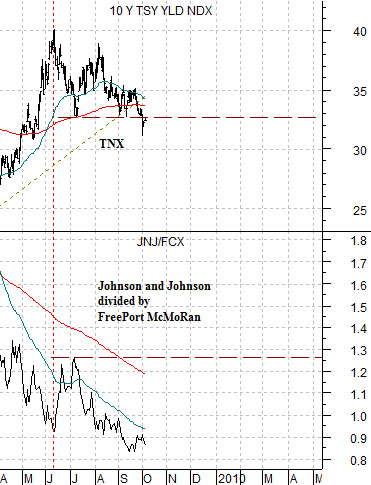
Now compare this with the current situation shown below right. Yields peaked in June while the JNJ/FCX ratio made new lows into September. In other words the bond market is ‘saying’ that growth is slowing while the equity market is arguing rather persuasively that it really isn’t. Eventually the divergence will expand to the point where one side or the other will have to break. Either higher yields or a sharp adjustment of relative equity markets prices.
To add to the shakiness of our knees we have now entered into the final quarter of 2009. In other words in less than three months the decade will conclude and we have argued on many occasions that the ‘end of decade’ theme tends to be marked by sharp price gains in one or more cyclical markets.
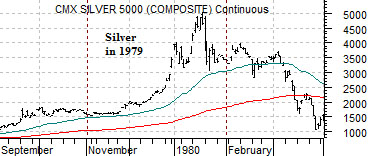
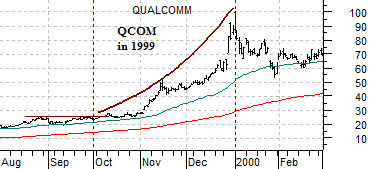
To explain we have included a chart of silver futures through the end of 1979 and the share price of Qualcomm (QCOM) during the final quarter of 1999 below. When you combine a pile of money chasing momentum with a short-term dead line (end of quarter, end of year, end of decade) prices can be pushed parabolically higher. Was yesterday’s break out by gold the start of a similar run? We don’t believe so (page 3) but, then again, stranger things have likely happened.