Back to the ‘fear trade’? Is the market going to follow the same paths carved out in 2010 and 2011 as cyclical asset prices moved lower through the second and third quarters? In truth… we don’t have to stretch too far to support this kind of outcome.
NEW YORK (CNNMoney) — Investors remained nervous Tuesday, and stocks dropped precipitously by the afternoon. Worries about Europe bubbled back to the surface, as borrowing costs in Spain and Italy continue to rise.
Let’s take a look at the bearish argument. Just because.
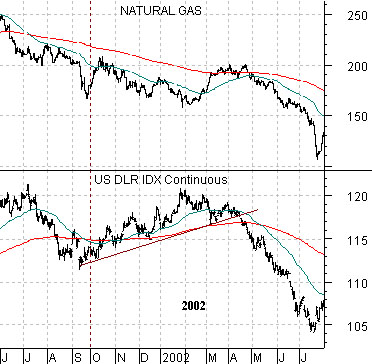
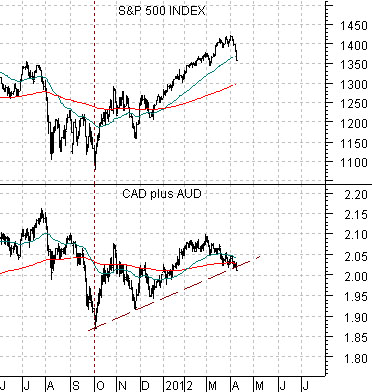
In previous issues we have argued that the bullish trend for the natural gas sector began back in 2002 as the U.S. dollar turned lower. We have compared the U.S. dollar from 2002 with the combination of the Canadian and Australian (CAD plus AUD) dollar futures in 2012 to show that the end of the ‘strong energy’ trend should go with weakness in these two currencies. Fair enough.
First is a comparison from 2002 between the Natural Gas Index (XNG) and the U.S. Dollar Index (DXY) futures. The dollar broke down in April of that year heralding in the start of a rising trend for energy-related equities. But… the twist here is that the XNG did not begin its decade-long relative strength run until after the dollar reached bottom in July.
Next is a comparative view of the S&P 500 Index from 2012 along with the sum of the Canadian and Aussie dollar futures.
With the cyclical trend appearing somewhat fragile at the present time an argument that would support additional weakness could easily be derived from this comparison. In other words… the broad large cap U.S. equity market has trended very closely with the commodity currencies for years so weakness in these currencies could easily lead to downward pressure on the SPX.
Our view is that the energy trend is weakening and that this will result in new winners and losers within the equity markets. Our near-term concern revolves around the prospect of lower stock prices in response to declining commodity prices and commodity currencies.
Equity/Bond Markets
In general… the S&P 500 Index has trended with the commodity currencies. We are using the term ‘in general’ because there has been the odd exception.
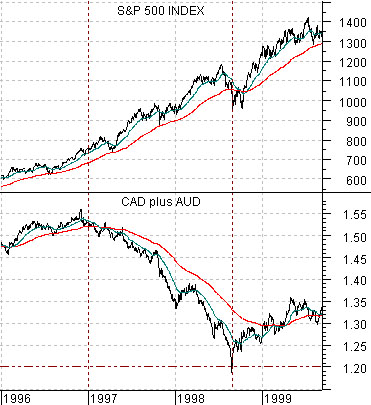
Below is a comparison between the S&P 500 Index and the sum of the Cdn and Aussie dollar futures from 1996 into 1999.
There was an 18 month period from the start of 1997 into the middle of 1998 when the SPX continued to rise even as the commodity currencies moved lower. While this was a fairly specific event the intermarkets are not that much different from today’s.
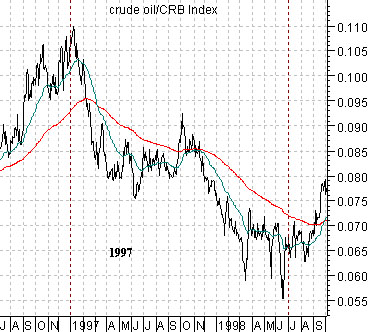
Below is a chart of the ratio between crude oil futures prices and the CRB Index from 1996- 98.
The key intermarket detail that began at the start of 1997 was… weakness for crude oil prices. The ratio between crude oil and the CRB Index peaked in early January of 1997 and eventually bottomed in June of 1998.
While it most certainly not a given… it is possible for the SPX to rise on weakness in the commodity currencies if the focus of that weakness is on energy prices.
In yesterday’s issue we attempted to show that there were a couple of potential outcomes. With a stronger U.S. dollar and rising bond prices the defensive and non-commodity sectors tend to outperform so we could continue to see rising prices for the health care, consumer defensive, and tech sectors.
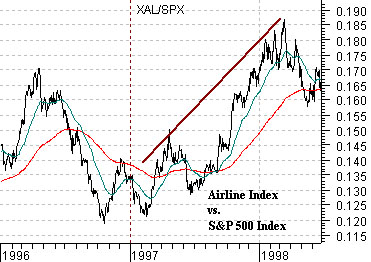
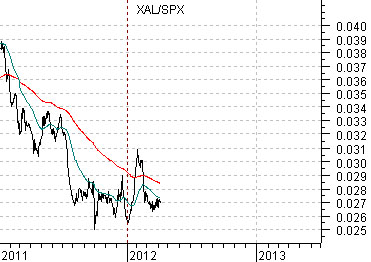
What really stood out, however, in 1997 was the strength in the ‘autos and airlines’ theme. The chart at right shows the ratio between the Airline Index (XAL) and SPX from 1996- 98 while below right is included the same ratio for the current time frame. The point, we suppose, is that the SPX can rise in response to energy price weakness but perhaps only if the markets interpret energy price weakness as a cyclical positive instead of a cyclical negative.