Is there a ‘crash’ on the horizon? Oddly enough… that just might prove to be the case.
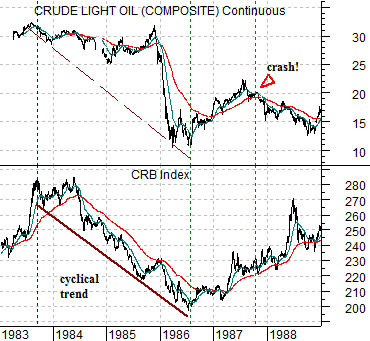
Just below is a chart comparison from 1987. The chart shows crude oil futures and the CRB Index from 1983 through 1988.
We are using the CRB Index to represent the basic cyclical trend. Commodity prices turned lower in 1983 and continued to decline through into 1986.
The key here is crude oil futures prices. Between 1983 and late 1985 crude oil prices defied the downward pull of the negative cyclical trend until finally collapsing to a bottom into 1986.
The first point is that the cyclical trend- as viewed through the CRB Index- was negative. The second point is that energy prices remained stronger for several years before finally breaking sharply lower into 1986.
What does this have to do with a stock market crash? Our view is that the 1987 stock market ‘crash’ was caused- at least in part- by energy price weakness in 1986. We will explain this point on the following page.
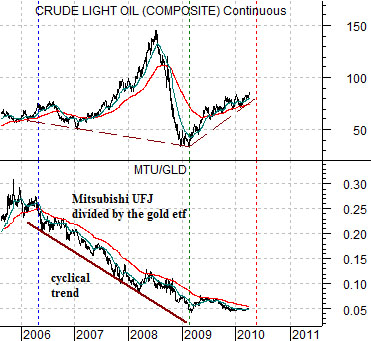
Below is a chart comparison between crude oil futures and the ratio between Japanese bank Mitsubishi UFJ (MTU) and the gold etf (GLD).
We have been using the MTU/GLD ratio to represent the cyclical trend. While this may appear to be somewhat arbitrary the idea has been that while the cyclical trend was defined by CRB Index in the 1980’s the weak link through the second half of the last decade was Japan. There are any number of ways that we could have shown this but for the time being we will argue that the MTU/GLD ratio is reasonably ‘fair’.
Similar to 1983- 86 the cyclical trend was negative from 2006 into 2009. Similar to the 1980’s energy prices remained inordinately and disproportionately stronger for some time before the weight of the cyclical trend caused prices to break substantially lower.
Our point is that if we look at the ‘cyclical trend’ and way crude oil prices reacted to the trend then there is a broad similarity between what happened into 1986 and the action into the start of 2009.


Our focus on today’s first page was to make the case that the collapse in crude oil futures prices in 2008 was actually quite similar to the way prices buckled towards the end of 1985. If one can accept our premise then we can move forward with our argument.
What does energy price weakness in 1985- 86 have to do with a stock market ‘crash’ in 1987?
The answer to this question is not based on the trend for energy prices specifically but rather on the relationship between energy and bond prices.
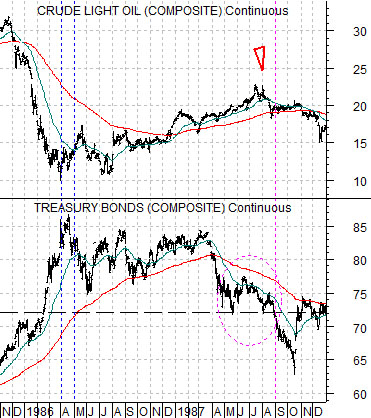
The chart below compares crude oil futures with the U.S. 30-year T-Bond futures from late 1985 through 1987.
When oil prices declined into 1986 the offset was a very strong bond market. In other words as oil prices declined… bond prices rose.
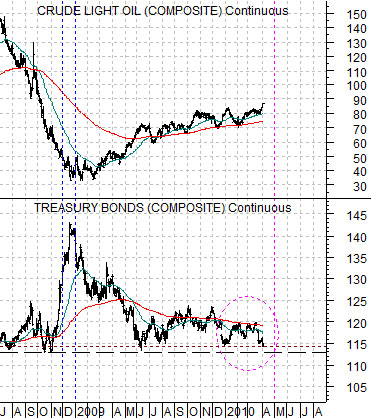
Further below we show the same comparison between crude oil and the U.S. 30-year T-Bond futures for the current time frame.
The chart shows that when oil prices declined through the second half of 2008… once again bond prices soared.
So… let’s go over this once again.
Between 1983 and late 1985 the cyclical trend was negative. Between 2006 and 2008 the cyclical trend was also negative.
Into 1986 crude oil prices fell to less than one third of 1985’s peak levels (from around 32 down to 10). During the second half of 2008 crude oil prices fell to less than one third of peak levels (from 147 down below 40).
The offsetting reaction into 1986 to falling oil prices was a sharp increase in the bond market. The offsetting reaction to energy price weakness in 2008 was a significant rally in the long end of the bond market.
Our point is that the weak cyclical trend/energy price collapse/rising bond market sequence that worked through into the spring of 1986 was in many ways identical to the sequence that occurred into December of 2008.
Once again… what does this have to do with 1987’s stock market crash?
We have argued that once the bond market peaked in 1986 it set into motion a trend that gathered momentum into 1987. This trend involved a strong cyclical recovery (rising crude oil prices) and rising interest rates.
When the TBond futures finally broke below support in late August of 1987 the ratio between equities (S&P 500 Index) and bonds (TBond futures) was driven to unsustainable levels as money flowed relentlessly from bonds into stocks. The ‘crash’ was simply the markets’ way of pulling relative prices back into line- quickly. Our concern today has to do with what might happen if the TBond futures fail down through support around the 113 level later this spring. If crude oil prices have already reached a top (similar to July of 1987) and bond prices break support then in too many respects for comfort the markets today line up quite closely with the late summer or autumn of 1987.


