We are going to start off today by showing a chart that we have been running in the back pages for the last week or three. Our view is that it does a fairly good job of explaining the recent heaviness of the commodity and equity markets.
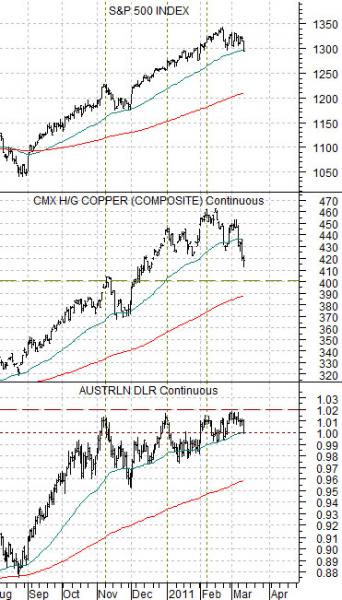
The chart compares the S&P 500 Index with copper futures and the Australian dollar futures.
The argument is that the Aussie dollar represents the flow of money towards the BRIC theme as well as the state of the commodity markets. The Australian dollar tends to do better when commodity prices are stronger while outperforming the Canadian dollar when money is moving away from the U.S. and towards Asia.
In recent months the Aussie dollar has made a series of peaks between 1.00 and 1.02 relative to the U.S. dollar. Once the Australian currency rises above parity with green back it has tended to struggle.
Peaks for copper prices have coincided with tops for the Australian dollar so as the AUD has approached 1.02 we have tended to find tops for copper futures.
The equity markets have been hard wired to the commodity cyclical theme so whenever the Aussie dollar and copper prices have been moving upwards the S&P 500 Index has tended to lift as well.
The problem for both copper and the SPX at present is that the AUD has failed to decline far enough from the 1.00- 1.02 trading range to give the markets sufficient breathing room for an extended advance. As each decline in the Aussie dollar has become smaller the rallies for both copper and the SPX have become shorter in terms of time.
Unless the markets change themes- a possibility we will discuss briefly on the following page- the most bullish intermediate-term outcome might well be a short-term decline in the Aussie dollar of sufficient consequence to open up some space for a rally back towards the 1.00- 1.02 region. Copper has rather major support between 4.00 and 4.05 so a pull back towards the rising 200-day e.m.a. line wouldn’t be too much of a surprise.
Equity/Bond Markets
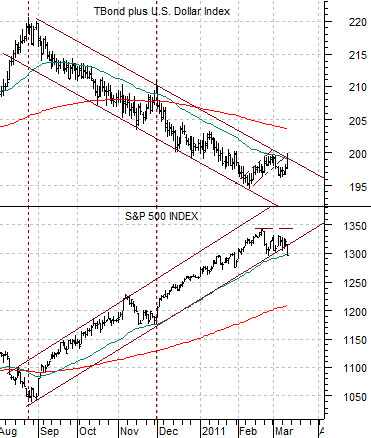
Below is a chart of the SPX along with the sum of the U.S. 30-year T-Bond futures and U.S. Dollar Index (DXY) futures.
The argument is that the equity markets are rising as the dollar and bond market are declining. As long as the dollar and bond market work gradually lower the SPX appears to be headed higher.
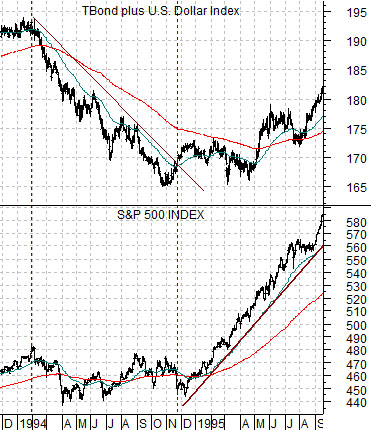
The problem with this relationship is that while it reflects the current state of the markets it is not a given that the stock market requires falling bond prices and dollar to move higher. In fact… the bull market that began in 1995 was based on the exact opposite relationship as stocks moved higher along with the dollar and bond market.
Next we show the TBonds plus DXY and the SPX from late 1994 into the autumn of 1995. Notice that the stock market remained flat through 1994 as the dollar and bond market declined and then sprang upwards once bonds and the dollar began to firm in 1995.
The point? The way the SPX relates to the sum of the TBonds and dollar reflects the strength of ‘cyclical’ versus ‘consumer’. A market driven by cyclical and foreign themes needs a weaker dollar and bond market while a market driven by U.S. domestic growth and non-commodity themes will thrive with stronger bonds and a rising dollar.
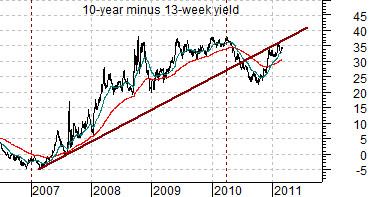
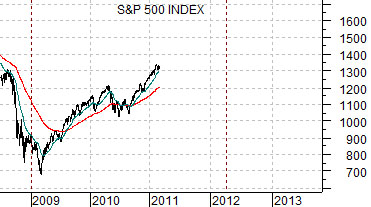
Moving on… our view is that the cyclical theme is going to remain strongly positive into 2012. Our view is that we are working through a correction in the trend instead of the end of the trend. Our view is that the lagged relationship shown below (SPX lined up 2 years after the spread between 10-year and 3-month Treasury yields) makes the compelling argument for at least another 12 months of rising asset prices. We show a longer-term view of this relationship on page 6 as we substitute the SPX for the combination of copper prices times the Nikkei 225 Index.