One of our recurring themes over the past few years has been that the markets have featured a strong energy and metals price trend through the first half of the year followed by ‘something else’ over the second half of the year. Given that ‘something else’ is a somewhat vague description of the trend we thought that we would show how this has manifested itself since 2006.
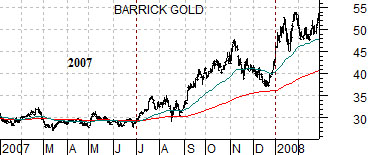
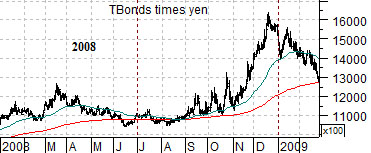
Immediately below we have included charts of AMR from 2006, gold miner Barrick from 2007, and the combination or product of the U.S. 30-year T-Bond futures times the Japanese yen during 2008.
In the midst of a strong commodity trend that pushed crude oil prices to a peak in mid-2008 there was a six month correction through the second half of 2006 that allowed the airlines a chance to ‘catch up’. After a decline into August of 2006 the share price of airline AMR doubled in price into early 2007.
The second half of 2007 was dominated by gold price strength with much of the action focused on the major gold producers. Barrick’s share price rose from the end of the second quarter- with a minor pull back into August- through into early 2008.
The final six months of last year focused on a defensive theme with money pushing into the safety of the Treasury market and the Japanese yen as commodity prices and the major financials crumbled.
The point is that the recent tendency has been for the markets to focus on the energy and base metals themes into the summer before shifting to what we term ‘something else’. In all three examples shown price strength began to build as we pushed out of the month of August lasting through into the start of the next year.
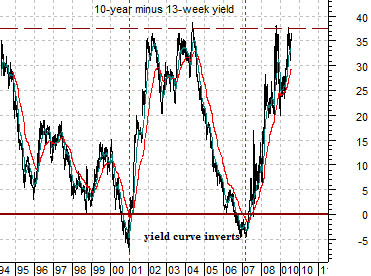
Below we show the spread or difference between 10-year and 3-month Treasury yields. Our quick point is that for as negative as the long end of the bond market has acted of late there has been a tendency for the spread between 10-year and TBill yields to peak somewhat below 4%. In other words… if the trend persists the only way that 10-year yields should be able to rise above 4% is if the Fed is ready to start raising the funds rate. While possible the argument would be that short of a major Fed policy reversal in the near future the yield on 10-year Treasuries would be expected to peak at or near current levels.

Equity/Bond Markets
To quickly finish up one of our first page points… the argument is that IF energy and base metals prices start to weaken THEN the trend that will tend to dominate into early 2010 will emerge as we move out of the month of August.
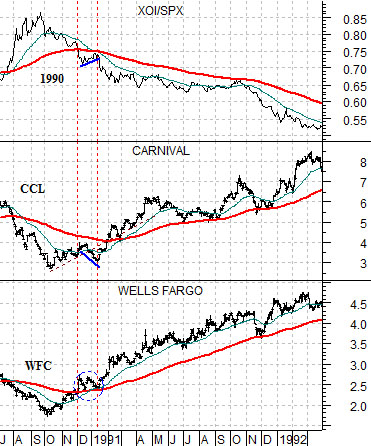
First up below we return to a chart-based argument that has graced these pages on many occasions over the past year or so. We show the ratio between the Amex Oil Index (XOI) and S&P 500 Index (SPX) from 1990- 92 along with the share prices of Carnival Cruise Lines (CCL) and Wells Fargo (WFC).
The idea was that at the peak for the oils relative to the broad market (XOI/SPX) we should be at the lows for both WFC and CCL and as the XOI/SPX ratio declines the share prices for the financials (WFC) and energy-using cyclicals (CCL) will rise. Fair enough.
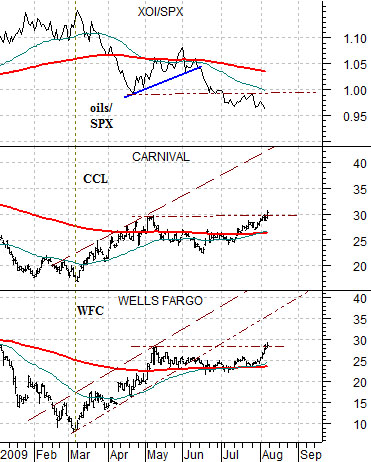
Below we show the current situation. After making a major peak in mid-2008 the XOI/SPX reached a second and lower top in early 2009 that marked the bottom for WFC and CCL. After all this time the recovery is progressing in a most tidy manner.
We use a number of energy-using cyclicals to represent the inverse or mirror-image of the ‘energy’ trend. At times we focus on Ford or AMR but quite often we use CCL. The argument has been that while new automakers and airlines can pop up from time to time the barriers to entry into the cruise ship business are fairly significant.
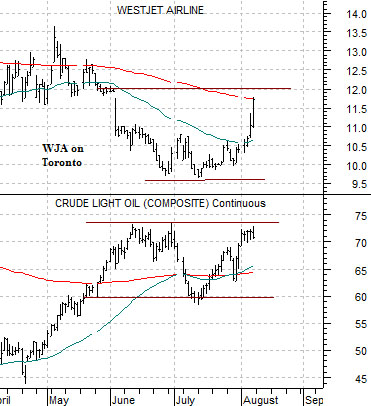
One of our favorite growth-oriented airline plays is Canada’s WestJet. It certainly does not have the price ‘whip’ afforded by something like AMR and Continental but, then again, it also tends to make fairly steady profits within an industry that is prone to more busts and booms. The chart below shows that WJA broke lower in May when oil prices pushed above 60 on the way to 74. The rally for WJA suggests that the markets have decided for the moment that crude oil prices reached a peak at or near 74.