It will likely take both the first and second pages for us to make our point. Patience may be required. As usual.
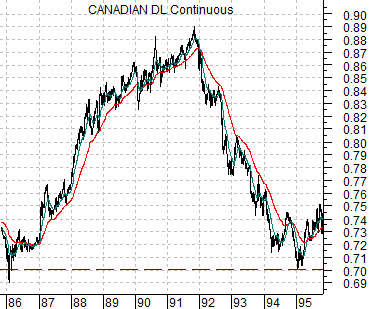
We are doing this from memory so we trust that accuracy in the details won’t be required. At right is a chart of the Canadian dollar futures from the end of 1985 into 1995.
Towards the end of the 1980’s the Bank of Canada under John Crow became concerned about the prospect of a return to rising inflation. A couple of decades later we know that the markets have spent the last 30 years moving inexorably from inflation towards deflation but after the pressures created through the 1970’s most central bankers used any excuse to raise interest rates. Just in case.
The idea was that if Canadian short-term yields were held 3% to 4% higher than similar U.S. yields this would help contain inflationary expectations. The end result was years of capital flows into higher yielding Cdn short-term debt which served to push the currency up from around .70 to a peak in the autumn of 1991 close to .89.
In the autumn of 1991 (we use the Citigroup/Wells Fargo ratio for this) it became clear that the U.S. economy was expanding at a faster pace. After peaking out in 1990 at close to 14% Cdn short-term yields fell to less than 4% into 1994 while the ‘hot money’ that had driven into the Cdn currency exited the trade as the Cdn dollar fell all the way back to its original starting level. The point? Interest rate spreads can drive currencies but only for so long.
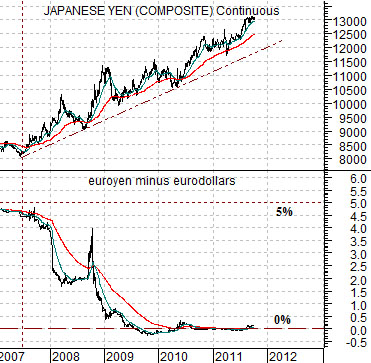
At bottom right is a chart of the Japanese yen futures and the price spread between 3-month euroyen futures and 3-month eurodollar futures. The spread measures the difference between U.S. and Japanese short-term yields so a level of 5.0, for example, goes with U.S. yields being 5% higher than similar Japanese yields.
The steady strength for the yen is largely a reflection of the collapse in U.S. housing prices, banking share prices, and short-term yields way back in 2007. At that time U.S. yields were roughly 4.5% to 5.0% higher than Japanese yields which created an outflow of capital from the yen towards the dollar in search of higher returns. As the spread collapsed back to 0% the ‘hot money’ that had moved into the dollar and euro from the yen reversed course causing the yen to trend upwards. Fair enough.
Equity/Bond Markets
One of the last ‘shoes’ to drop in terms of a more bullish asset price trend appears to be yen weakness. In other words a key ‘driver’ for Japan’s export-based sectors is a weaker yen but day after day, week after week, and month after month the yen keeps grinding higher.
The chart on page 1 argues that the yen may continue to rise until the spread between U.S. and Japanese short-term interest rates once again begins to widen. As U.S. yields push higher the flow of ‘hot money’ will start to move from the yen back to the dollar.
So… what happens when the Fed states that it plans to hold the funds rate at extremely low levels into 2013? First, the U.S. yield spread begins to flatten. Second, the Japanese yen moves higher. Both, by the way, are rather intensely negative for risk-based asset prices. In a perfect world the Fed would grasp the relationship between its stated intentions and the ensuing asset price collapses… and then acknowledge that it actually has no idea when it will begin to raise the funds rate.
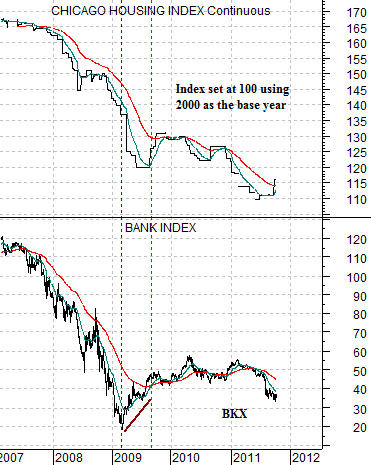
At right is a chart comparison between the Chicago Housing Index futures and the Bank Index (BKX).
There are a number of housing index futures contracts that we follow. We are using Chicago… for no particular reason. The individual city indices were set at 100 using 2000 home prices as a base. At, say, 115 the Chicago Housing Index futures suggest that home prices in that city are about 15% higher than they were 11 years ago.
The argument is that the Bank Index collapsed with housing prices. We would also argue that the Bank Index should ‘lead’ to both the upside and the down side so as long as the banking shares continue to languish there is little in the way of hope for a broad-based recovery in U.S. real estate prices.
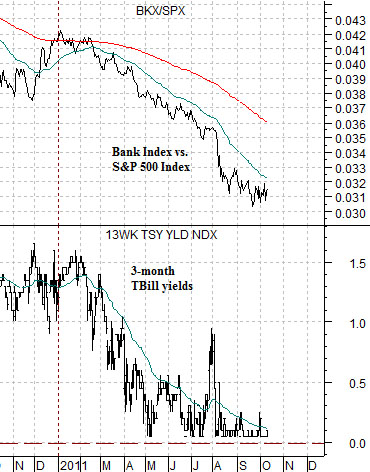
Below right is a chart of the ratio between the Bank Index and the S&P 500 Index along with U.S. 3-month TBill yields.
We trust that the relationship appears somewhat clear. When the banking shares are weaker than the broad U.S. stock market we end up with downward pressure on short-term yields.
In a sense if we go around and around and around using this particular argument we end up with the following conclusion.
The Fed does not set short-term interest rates- the markets do. The Fed will raise the funds rate when the markets push 3-month TBill yields up through the overnight funds rate.
Upward pressure in TBill yields won’t begin until the Bank Index starts to significantly outperform the S&P 500 Index.
When the BKX/SPX ratio does start to power higher it should mean that we are getting closer to a period of strength for U.S. housing prices.
When U.S. short-term yields start to rise the spread between U.S. and Japanese yields should widen. This will lead to a weaker Japanese yen which will, in turn, help to create a more upbeat trend for the Japanese stock market.