We have what we believe is an interesting perspective on what the markets are building up to over the next week or two but before we can get to an explanation we have to lay a little ground work first.
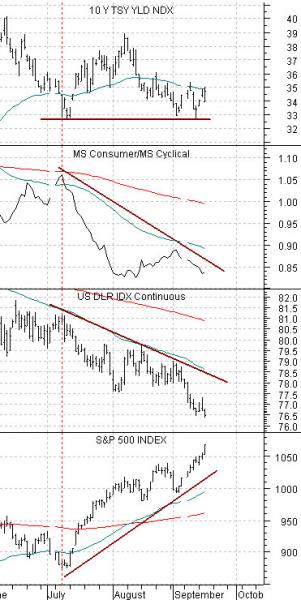
At right is a comparative view of the yield index for 10-year U.S. Treasuries (TNX), the ratio between the Morgan Stanley Consumer Index and Cyclical Index (consumer/cyclical), the U.S. Dollar Index (DXY) futures, and… the S&P 500 Index (SPX).
The trend over the past couple of months has been well defined. Dollar weakness is pushing commodity prices higher which is, in turn, helping to create the impression that cyclical growth is booming. In turn the consumer/cyclical ratio is falling as money jumps out of the plodding value stocks and into economically sensitive sectors.
We have included the 10-year yield index because almost all of this relates to the bond market. The low point for yields was reached last December and through trading yesterday the trend for interest rates was still higher. This makes sense, of course, because if yields were not trending upwards it would difficult for the markets to push so hard towards the various cyclical themes.
Our point is that there are two components to the current trend- dollar weakness and rising interest rates. The former reflects the flow of money away from the U.S. towards more cyclical, more commodity-related, or higher yield sectors while the latter confirms that the trend is rational because rising interest rates go with economic strength.
If the trend is based on dollar weakness and rising interest rates then risk going forward comes from dollar strength or falling yields. We have beat the argument to death that falling ocean freight rates are pointing towards economic weakness later this year so our focus today will be on what might have to happen to swing the dollar back to the upside.
Our argument begins with a look back at what happened post-Asian crisis in 1999 because- at least in terms of markets action and ‘time’- the similarity to later this month is really quite intriguing.
Equity/Bond Markets
We are going to take a bit of a leap here. A shot in dark if you will. The argument begins with our page 5 observation that the chart of China’s Shanghai Composite Index looks quite similar to the S&P 500 Index through the first quarter of 1994. As we have shown and explained in past issues the small ‘crash top’ that broke in March of 1994 represented one of very few occasions when a crash top broke ahead of the end of a quarter.
The point is that chart-wise the Shanghai Comp. looks as if it is approaching a decision point. It looks as if the resolution of whatever forces are pushing and pulling on it could come before the quarter end. It looks as if it has spent the last month and a half setting up for an event that may, in fact, be due next week.
Is anything of importance scheduled for next week? Our thought is that it may well be the 2-day Federal Open Market Committee meeting scheduled for September 22nd and 23rd.
We haven’t commented on any of the last few FOMC meetings because they really felt like non-events. Perhaps- just perhaps- this time is different.
In general (i.e. almost always) the Fed follows the markets and through trading yesterday the expectation in the Fed funds futures was that there was a 100% chance that the funds rate, currently between 0% and .25%, would be set no higher than .25%. Fair enough.
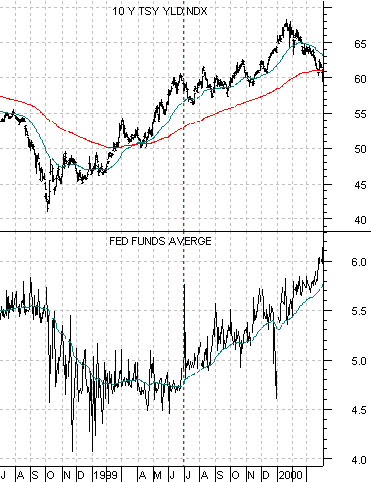
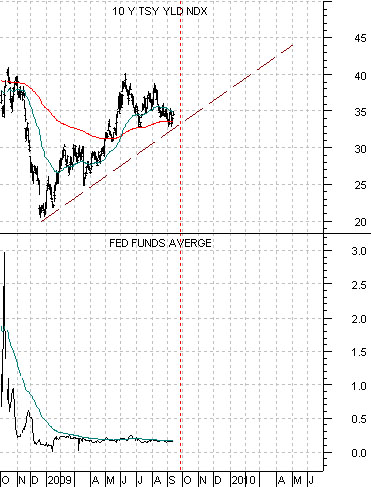
At right are two charts of 10-year Treasury yields (TNX) and the Fed funds target rate. The top chart starts in July of 1998 and runs through March of 2000. The lower chart starts in October of 2008 extending to the present time frame.
The charts are set up so that the low point for 10-year yields at the end of the third quarter of 1998 is lined up with the low point for 10-year yields at the end of last year’s fourth quarter.
So… following 1998’s Asian crisis when did the Fed make its first move to increase the funds rate? At the June 30th meeting in 1999. The Fed raised the funds rate from 4.75% to 5.00% nine months AFTER long-term yields began to trend higher.
What is similar between the current trend and 1999 is the speed with which the markets shifted back to a ‘strong cyclical’ trend. Following the collapse of Asian growth, the low point for commodity prices, the LTCM debacle, the Russian debt repudiation, and an early 1999 crisis in Brazil the Federal Reserve began to raise the funds rate nine months after long-term Treasury yields began to trend higher.
Our point is that while we all know that 2009 is far worse than 1999… it is also true that the markets are reacting in a very similar manner. When the FOMC meets next month they will be doing so almost exactly nine months after the low point for long-term yields.
Our thought is that an equity markets trend that is being driven by a weaker dollar may not fare all that well if the Fed steals a march on the markets and raised the Fed funds rate next week. Our thought is that this might be exactly why the Shanghai Comp. has been working through a potential ‘crash top’ since the start of August.