This has most certainly been an interesting week. Toss in an unexpectedly strong (i.e. a lower number) U.S. weekly jobless claims report today… and it might get even a bit more colorful. Of course we have no knowledge of what the jobless claims report will look like but a solid number under 400K would definitely be a positive.
In terms of the intermarkets… the real key seems to be the direction of the U.S. dollar and the long end of the Treasury market with gold going along for the ride.
The dollar has been more or less flat since the end of April with a trading range between 73 and a bit more than 76.
The long end of the Treasury market was stronger in price through last week but has started to break rather dramatically lower.
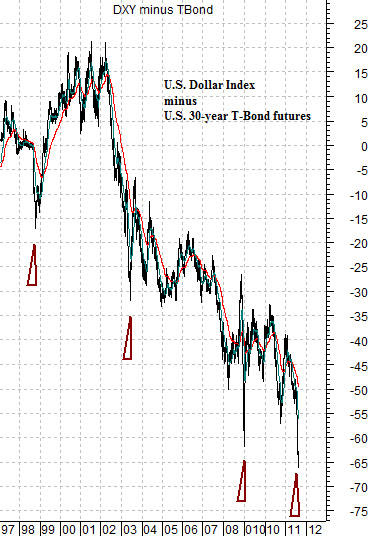
Below is a chart of the spread between the U.S. Dollar Index futures and the U.S. 30-year T-Bond futures.
The spread declines when the dollar is weaker than long-term Treasury prices. For example, if the DXY was 75 while the TBonds were 100 the spread would be -25. If the DXY fell to 70 with the TBonds holding flat at 100 the spread would decline to -30. Conversely if the DXY held even at 75 while the TBonds rose to 105 the spread would also decline to -30.
The chart covers the time period between 1997 and the present day. While there are quite a number of ‘bottoms’ along the way the three previous instances that really stand out are late 1998, mid-2003, and the end of 2008.
If what we are seeing this week is a pivot up from a major low in the spread between the dollar and TBonds then this would be the fourth major low in more than a decade.
We went through a number of sector ratios to see if a spike bottom for this spread went consistently with outperformance in a specific asset class and ended up concluding that the message was somewhat more broad. And bullish. We will explain this on the following page.
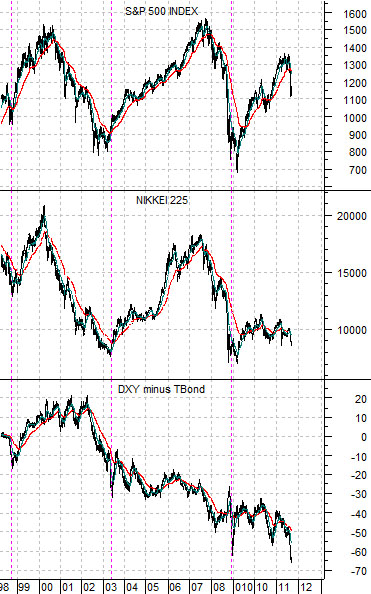
Equity/Bond Markets
Next is a chart of the spread between the U.S. Dollar Index and U.S. 30-year T-Bond futures along with the Nikkei 225 Index and the S&P 500 Index.
The argument is that the spread between the dollar and bond market is starting to rise after making a rather pronounced spike low. The next point was that this is somewhat similar to 1998, 2003, and the very end of 2008.
The most consistent outcome following a spike low for the spread is… rising equity prices. Both the U.S. and Japanese equity markets have shown a strong tendency to rise when bond prices are falling and this can be seen on this particular chart comparison.
The point is that after the recent hard decline there are going to be many who argue that rallies should be sold. In fact… if this weren’t the case we would be concerned. There will be many who were sellers over the last few trading days who will now hope for a retest of the lows to put new positions on. Our argument is that based on the relationship between the relative strength of the dollar to the long end of the bond market a bottom has been made for the S&P 500 Index with higher prices to follow.
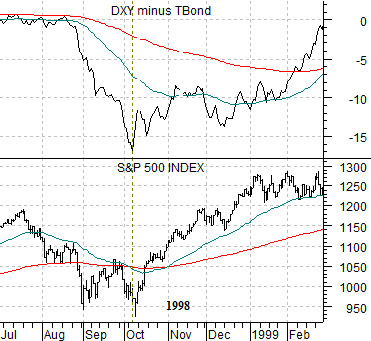
Let’s tighten up the time frames somewhat and compare the SPX with the DXY minus TBond spread from 1998.
The 1998 example is included below right with the present situation shown below.
The point is that when the spread pivoted higher in October of 1998 the SPX swung upwards. And then continued to push upwards. In fact there wasn’t much of a correction until the SPX had retraced the entire decline back up to 1200 by late November. If 2011 proves to be at all similar to 1998 then we might see a steady rise all the way back to 1350 before the pace of the advance begins to slow.