In a sense the markets are ‘in between’ with respect to energy prices. Crude oil futures are no longer strong enough to help support the share prices of the energy producers yet remain too strong to create a positive trend for the energy users. One might argue that this is fairly close to the worst of all possible worlds… as confirmed by the recent action in the equity markets.
Our view is essentially as follows. We believe that energy prices have dominated the trend over the first half of the year- as has been the case in recent years- and that this strength has been doing damage to consumer discretionary spending. We believe that energy prices will weaken over the final six months of the year and that this will reinvigorate the cyclical trend while turning long-term yields back to the upside.
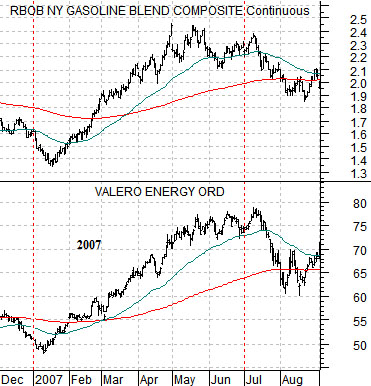
Below is a chart from 2007. The comparison is between gasoline futures and the share price of oil refiner Valero (V LO).
We have argued on many occasions in the past that the first half of the year tends to be dominated by one or more energy price themes including gasoline, natural gas, coal, and even uranium. For some inexplicable reason the markets tend to drive the energy trend higher from January through June before shifting over to another theme for the remainder of the year.
In 2007 the trend was driven in large part by the perception that there was a shortage of gasoline supply. As the crack spread widened the share prices of the refiners pushed upwards with Valero’s stock rising from under 50 to over 75. Then… the second quarter ended and money flowed over to new momentum-based ideas.
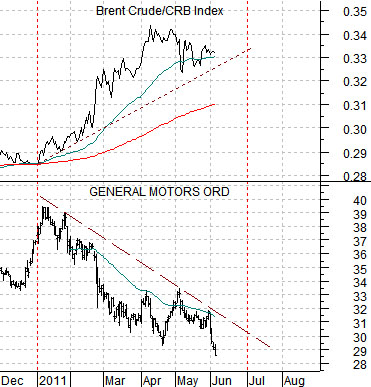
Below is a chart comparison between the ratio of Brent crude oil futures to the CRB Index and the share price of General Motors (GM) from 2011.
We are arguing that Brent crude oil prices have been the dominant theme so far this year with natural gas, gasoline, and West Texas Intermediate prices going along for the ride. Our contention is that the offset to a rising Brent crude/CRB Index ratio is downward pressure on the auto stocks so the higher and longer this trend runs the deeper the price hole for GM. The good news is that we are not that far from the end of the current quarter while the bad news is… that the current trend could still run for another month or so.
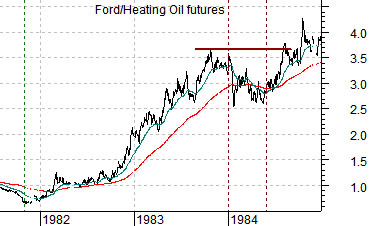
Below is a depiction or representation of where we believe the markets are at this time.
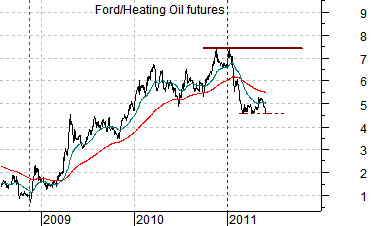
We have included two charts of the ratio between Ford (F) and heating oil futures. The top chart starts in late 1981 while the lower chart begins in 2008.
Our view is that the current trend is similar in some ways to the stock market correction in 1984. We believe that the most likely outcome going forward is some combination of auto share price strength and energy price weakness. In other words… similar to 1984 the Ford/heating oil ratio has hit a pothole and, similar to 1984, the ultimate resolution will involve some combination of stronger energy ‘users’ share prices and weaker energy prices.
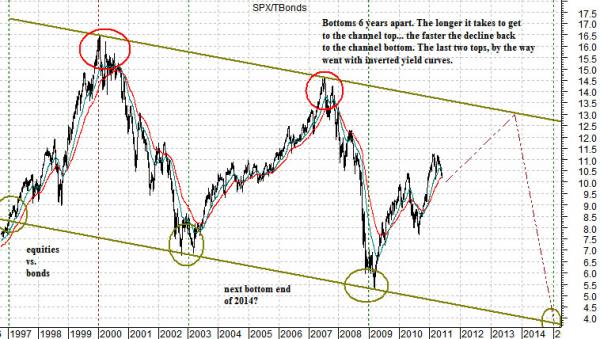
Below is a chart of the ratio between the S&P 500 Index and the U.S. 30-year T-Bond futures.
The argument here is that this ratio has tended to bottom about every six years with the next low potentially due around the end of 2014.
In yesterday’s issue we showed the 3-year lag between Mitsubishi UFJ (MTU) and the 30-year minus 5-year yield spread. We suggested that the spread (charts on page 6) made the case that the next cyclical peak was unlikely to occur until some time late in 2013.
The point? The SPX/TBond ratio tends to peak when the yield spread inverts and that won’t happen for some time. The charts suggest that the next ratio peak should be due in late 2013 (at the earliest) while the next bottom may be made in late 2014. All things considered the idea is that we should hold a generally positive but choppy trend into late 2013 as the SPX resolves back up towards 1550 with the potential for a repeat of sorts of 2008 during the year 2014.