We have been arguing of late that gold prices could tumble later this summer. Our intention today is to quickly run back through the chart comparison that we have been working with and then push on to explain what this would mean with respect to some of the other markets. In a sense we aren’t suggesting that gold prices have to fall but instead are attempting to show what would have to happen to make this outcome possible.
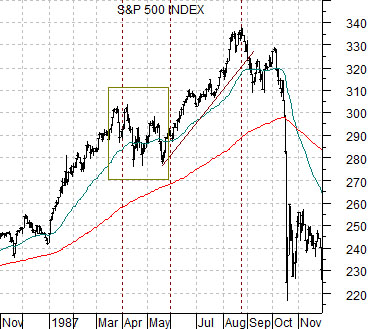
Just below is a chart of the S&P 500 Index (SPX) from the end of 1986 into 1987. This particular perspective captures the stock market’s October 1987 ‘crash’.
The 1987 ‘crash’ was largely the end result of a stock market rising on falling interest rates and expanding valuations running into a rebound in commodity prices that pushed interest rates higher to the point where stock prices collapsed. The end result was a return to a bullish trend through into 1990.
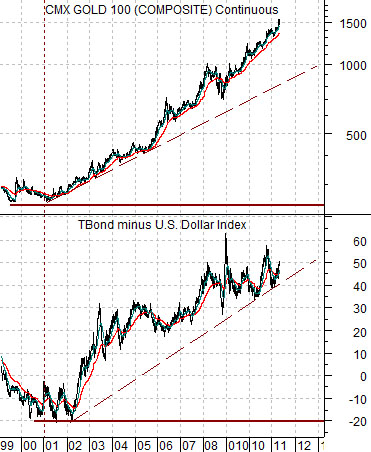
From an intermarket perspective gold prices have been rising based on two factors. First, the dollar has been weaker. Second, there has been downward pressure on interest rates. If pressure is going to develop with respect to the trend for gold prices it will likely have to come from either a much stronger dollar, a much weaker bond market, or… both.
Chart-wise there is a certain similarity between the way the SPX rose through 1987 and the ascent for gold prices since the summer of last year. The SPX made an initial rise into the spring of 1987 before staging a two-month correction in the face of falling bond prices. Once bond prices flattened out the equity markets extended the rally into late August only to be met by a second wave of selling in the long-term Treasury market that swept bond prices to new lows. By the start of the fourth quarter the equity markets snapped lower literally wiping out a full year’s worth of gains in a matter of a few days.
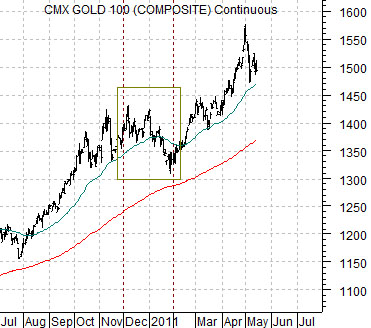
Gold futures rose from the end of July last year into December before working through a two-month price correction. From February through April the trend swung back to positive. On a comparative basis recent weakness suggests at least the possibility that we have entered into a second period of correction that will either resolve once again to new highs as the third quarter begins or, similar to the 1987 stock market, knock a full year’s worth of price gains off of this market.
Equity/Bond Markets
Next is a comparison between gold futures and the SPREAD between the price of the U.S. 30-year T-Bond futures and U.S. Dollar Index (DXY) futures.
The SPREAD rises when the bond market is strong or when the dollar is weak. Put another way a rising bond market represents falling long-term interest rates and the lower yields move the higher the valuations for financial assets expand.
Now… we acknowledge that the last great bull market for gold prices through the 1970’s was hardly a time of falling interest rates. In fact the trend through the final few years of that decade was the exact opposite as U.S. 30-year T-Bond futures prices plunged almost 50% from mid-1977 into the first quarter of 1980. Our thought is that the rising trend for gold prices was more a function of falling real interest rates rather than rising nominal interest rates as inflation ramped up even faster than yields.
In any event… the argument is that the rising trend for gold prices from the start of 2001 through into 2011 has gone with a fairly constant rising of the spread between bond prices and the dollar. Over time the dollar has been weaker while the bond market has been stronger.
Our view is that to be bullish on gold one has to expect that the dollar will continue to decline and that cyclical growth will not expand in any way, shape, or form to the point where interest rates start to rise once again. Considering that ten years ago the price of the TBond was as much as 20 points UNDER the value of the U.S. Dollar Index while today it is closer to 50 points OVER the dollar we do not think that it is inconceivable that the markets are approaching a point that could well represent a ‘perfect storm’ for the gold market.
If the spread between the TBond and DXY were to rise from 50 to 60 and then on towards 70… we couldn’t even begin to guess how high gold prices might rise. After all, when the trend on an exponentially-scaled chart starts rising parabolically… the next upleg might make the sides of the Empire State Building look flat.
On the other hand… if the spread between the TBond and DXY were to pull back below 40 through some combination of dollar strength and rising long-term yields… then the price of gold could decline some distance before long-term support is reached.
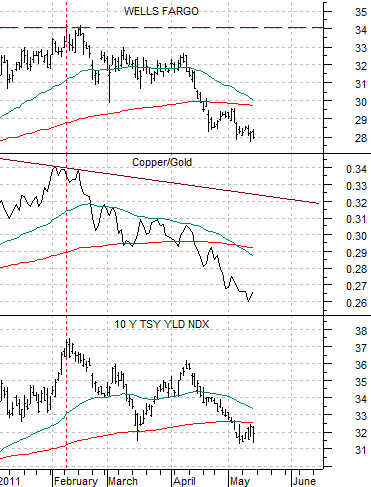
Further below is a chart comparison between Wells Fargo (WFC), the ratio between copper and gold futures, and 10-year U.S. Treasury yields.
Our argument is that all three charts represent the same general trend. Our view is that the banks are falling with yields and when yields are weaker the price of copper weakens relative to gold. What this means is that if we are to contemplate a bearish outcome for gold then we are, in effect, making an equally bullish argument with respect to both yields and the equity markets sectors that are trading with yields.
As an aside… we are going to show a slightly different view of the gold price trend on page 5 today. The twist here is that gold has essentially been rising for three months and correcting for three months suggesting that if prices do break lower it may not occur until sometime in the month of July.