The Fed raised the discount rate 1/4% as we were midway through setting up today’s issue. Given that we already had all of our topics and charts ready to go we won’t make any adjustments. The initial reaction by the markets, however, was negative for bonds and equities and positive for the dollar. We should note that when the Fed began raising the funds rate in 2004 it led to several months of lower long-term Treasury yields. 10-year yields declined from around 4.85% in June of 2004 down to around 4% in September.
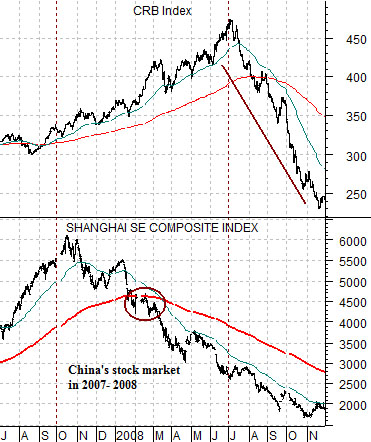
Below is a chart of China’s Shanghai Composite Index and the CRB Index from July of 2007 through November of 2008.
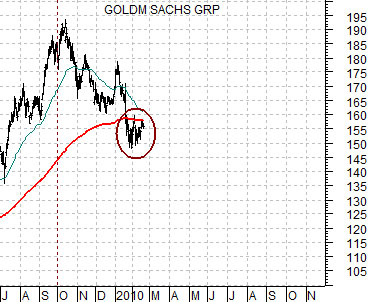
Below we have included a chart of Goldman Sachs (GS) starting in July of 2009.
The argument is that the chart pattern for Goldman Sachs is uncomfortably similar to that of the Shanghai Comp. two years previous.
The Shanghai Comp. peaked in October of 2007 and then declined below its 200-day e.m.a. line in late January of 2008.
Goldman Sachs reached a high in October of 2008 and fell below its moving average line towards the end of last month.
This is a view that we actually hope does not work but as long as GS continues to track the same path of the Chinese shares market we thought we might as well feature it. This will obviously become just a bit more interesting if GS breaks below last month’s lows (i.e. 148) in March.
There are two details that probably bear mentioning here. First, the Shanghai Comp. represented one of those ‘it should have been obvious’ relationships. To the extent that the bullish commodity price argument was in large part predicated upon Chinese demand a melt down in the Chinese stock market was a rather compelling signal that demand was starting to slow.
The second point is that there was a lag of about nine months between the peak for the Shanghai Comp. and the realization in the commodity and equity markets that the world was coming to an end. If GS continues to press lower through the spring then the conclusion drawn from this comparison would be that we are facing a tough second half for this year.
Equity/Bond Markets
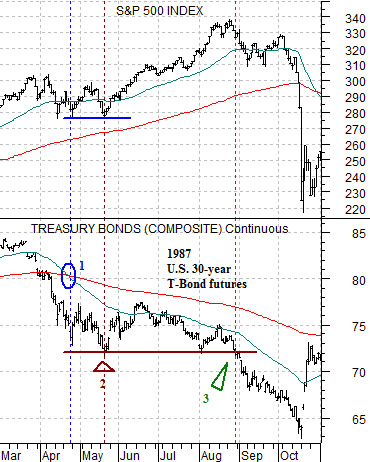
Next we show a chart comparison from 1987. The chart includes the S&P 500 Index (SPX) and U.S. 30-year T-Bond futures.
The argument is that the stock market today is trading off of the euro in a manner similar to the way that it reacted to bond price weakness back in 1987. Hopefully the ultimate outcome will be different since ‘crashes’- even when anticipated- are uncomfortable events.
Our view is that the situation today is roughly similar to the time frame between late April and late May in 1987. In other words in 1987 bond price weakness led to a ‘crossing’ of the moving average lines towards the end of April. The actual price lows for the bonds was not reached until close to one month later.
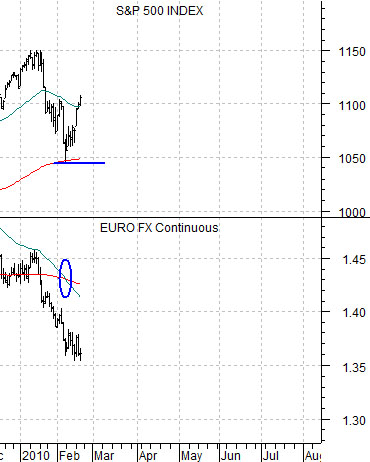
Below we show the SPX and the euro futures from the current time period. We argued a few weeks back that there could be two ‘chart points’ to keep an eye on. If history were to repeat the SPX should bounce upwards soon after the two moving average lines ‘crossed’ and then retest the lows as the euro finally moved to an intermediate-term bottom.
If the argument were to work perfectly and precisely then the SPX should have made a low during the first half of February on the crossing of the moving average lines followed by a second bottom in March that would line up with the low point for the euro.
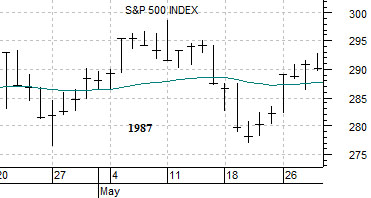
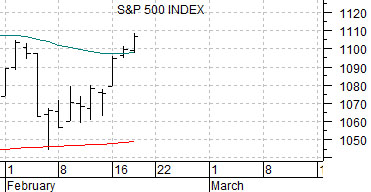
We try not to get ‘too short-term’ but ahead of the Fed’s surprise increase in the discount rate we had set up the two charts below. What we are looking at is a close-up view of the SPX between April and May in 1987 and the SPX today. We are comparing the initial bounce in the equity markets in late April following the ‘cross’ of the TBonds’ moving average lines with the rally that the equity markets have made this month following a similar cross by the euro’s moving average lines. A literal interpretation suggests… a return to or towards the lows with a bottom around the second week in March. The good news is that this could lead into a sustained rally for equities from March into May.