We are writing this ahead of the results from Greece’s election as well as the reaction through the Asian markets. We have absolutely no idea how the markets will deal with the news but, as usual, in short order the focus will shift from Greece to the potential for additional Fed easing and/or the Euro summit to be held later this month in Brussels.
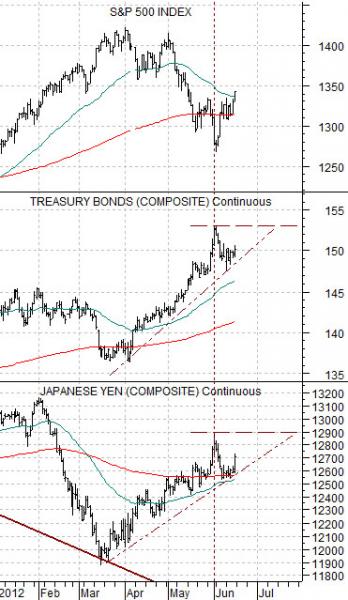
Below is a chart comparison of the S&P 500 Index (SPX), U.S. 30-year T-Bond futures, and Japanese yen futures.
The intermarket argument is that the Japanese yen and long-term Treasury prices are rising as money moves away from ‘risky’ assets. The perception is that the Eurozone crisis is leading towards slower growth which puts pressure on commodity and equity prices. Whether this is rational or reasonable is not really the issue given that this is the way money has been flowing in response to recent crises.
The bearish interpretation would be that the Japanese yen is still trending to the upside while the long end of the Treasury market makes one new high after another. The rising trend for both markets dates back the middle of March this year with the offset coming from a declining trend for the S&P 500 Index.
The reality is that the SPX and CRB Index have been under pressure as the Japanese yen and TBond futures have trended upwards. It would take more imagination than even we can muster to make the case that the yen and TBonds have stopped rising and are now in the process of moving lower. Yet… there is still the possibility that this is exactly what is happening.
The point is that the TBond futures and yen rose to a price peak at the end of May and have- so far- failed to make new highs. With the bond market and yen calming down the S&P 500 Index was able to rally back to the north side of its 200-day e.m.a. line. Not, of course, that this means all that much but it does make the case that the cyclical trend is ready, willing, and able to turn bullish on even the smallest of cracks in the rising trend for bonds and the yen.
Going forward… anything north of 153 for the TBond futures will go with considerable downward pressure on equities and commodities. The same should be true for a rise in the yen through 1.29.

Equity/Bond Markets
The Decade Theme argues that we probably have a few more months of bearish pressure to deal with before the markets are ready to turn bullish for an extended period of time.
We are going to attempt to go back over what we mean by the Decade Theme as well as how it may impact the markets through the balance of this year.
The Decade Theme is something that we came up with years and years ago. The idea is that the markets keep repeating the same basic trends from decade to decade.
Commodity prices peaked in 1980. The Japanese stock market topped out in 1990. The Nasdaq rose to a bubble peak in 2000. Three decades in a row ended with a major market in a price bubble followed by a period of cyclical weakness. Counter-trend corrections tend to take place in the ‘4’ year, crashes and crisis occur in the ‘7’ and ‘8’ years, with concentrated cyclical strength showing up in the ‘9’ year.
The problem is that from decade to decade the cast of characters keeps changing. Our view was that the cyclical trend was dominated by commodities through the 1970’s, Japan in the 1980’s, large cap U.S. and tech in the 1990’s, and then back to commodities through the 2000’s. The expectation was that the commodity trend would bust early this decade leading into a consumer-oriented trend that would herald the return of economic vigor in Japan. We shall see.
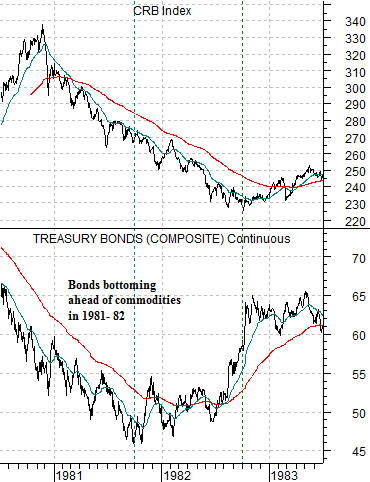
Below is a chart of the CRB Index and the U.S. 30-year T-Bond futures from 1980 into 1983.
The dominant theme in the 1970’s was related to commodity prices. The CRB Index peaked in 1980 and bottomed in the autumn of 1982. The market that ultimately put pressure on cyclical growth was the bond market as falling bond prices (rising interest rates) cooled demand.
Put another way… falling bond prices led to weakness in the CRB Index. The TBond futures bottomed in the autumn of 1981 and the recovery in the bond market acted as the leading edge of the recovery for commodity prices. Bonds bottomed in price about one year ahead of the CRB Index.
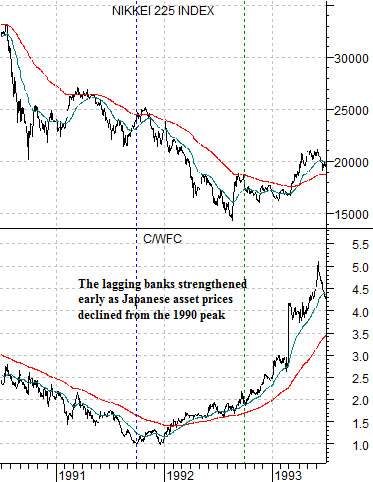
Next is a chart of the Nikkei 225 Index and the ratio between Citigroup (C) and Wells Fargo (WFC) from 1990- 93.
The C/WFC ratio represents the relative strength of international banks compared to domestic banks or, perhaps, lagging banks to leading banks. It may actually represent banks exposed to foreign problems (i.e. Citigroup) compared to banks focused on the U.S. housing and mortgage market (i.e. Wells Fargo).
The C/WFC ratio bottomed in the autumn of 1991. The idea is that this ratio led to the down side and then- in the final quarter of 1991- started to lead back to the upside.
The Nikkei 225 Index represents the dominant theme through the 1980’s while the C/WFC ratio represents the leading edge of the recovery. Similar to 1981- 82 the previous decade’s dominant theme did not bottom out until the final quarter of the ‘2’ year with the recovery starting to form a year previous in the autumn of the ‘1’ year.


