We have been arguing in favor of the Japanese yen for quite some time but we thought that we would attempt to explain where our bias comes from. To do so, however, we need to return to the action of the Canadian dollar through the late 1980’s.
What does the Cdn dollar from twenty years ago have to do with the Japanese yen today? We will suggest that both were and are the victims of an extreme monetary policy posture.
John Crow became the fifth Governor of the Bank of Canada in February of 1987. Similar to Paul Volcker he was determined to stamp out price inflation and to do so he kept short-term Canadian interest rates far above similar U.S. yields. The end result was a steady flow of capital from the U.S. into the Canadian dollar causing the currency to trend higher from 1987 into the end of 1991.
In an abstract published in 1992 in the Canadian Institute of Chartered Accountants CA Magazine economist Ernest Stokes wrote that Mr. Crow’s anti-inflation policies had cost Canada something like $30 billion in lost total output, added $50 billion to the deficit, and resulted in 360,000 lots jobs. In the end, however, Mr. Crow did bring Canada’s inflation rate down to the 2% policy target.
The first point is that when a central bank decides for one reason or another to keep short-term interest higher than necessary the market will respond by pushing capital in that direction. As long as the yield spread is sufficiently wide money will continue to flow through the gateway of the foreign exchange markets.
The second point is that policy aberrations can’t last forever. They can be maintained for years but eventually prices will come back into line.
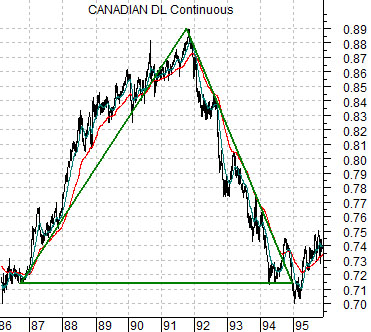
The chart below makes the case that as long as the Bank of Canada was fighting inflation by holding Cdn interest rates 300 to 400 basis points above similar U.S. yields the markets were more than happy to accept the ‘free lunch’. As money moved into Canada the Cdn dollar rose relative to the U.S. dollar but over time the combination of artificially high interest rates and a strong currency resulted in billions of dollars worth of foregone output, increased government debt, and lost jobs.
When the Bank of Canada declared policy victory in 1992… what happened? The Canadian dollar reversed course until by early 1995 it had returned back to its original starting point.
Ironically… John Crow’s dogmatic view that inflation must be tamed came right in the middle of multi-decade trend towards disinflation. By 1994 Canada’s inflation rate had fallen to 0% and as the Asian/commodity crisis hit during 1998 central banks globally were faced with the very real prospect of outright deflation.
In any event… what does the Cdn dollar from twenty years ago have to do with the Japanese yen today? Quite a bit actually.
The Bank of Japan has flirted with a zero percent interest rate policy for much of the last decade. Some may argue that at 0% Japanese interest rates were still ‘too high’ but the impact of offering free money into a world inclined to accept it to invest in everything from short-term U.S. Treasuries to European bonds to commodities and emerging markets equities helped fuel the most recent asset price bubble. As long as Japanese interest rates were sufficiently low relative to the U.S. and Europe the flow of money out of Japan helped to push the yen lower. In our Canadian dollar example we can see that when the interest rate spread narrowed the Canadian dollar declined. Our view has been that as virtually all major central banks pull their policy rates down towards Japan’s we will get a similar outcome. After years of holding the yen lower a policy pivot point was reached in mid- 2007 leading- inevitably an inexorably- towards a stronger Japanese yen.
Equity/Bond Markets
As long as we are on the topic of the Japanese yen we might as well run with it for just a bit longer.
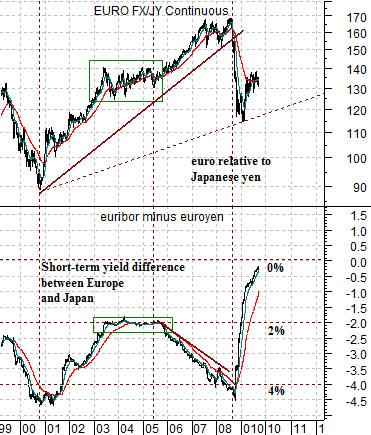
Below is a comparison between the cross rate of the euro and the yen and the price spread between short-term European debt (3-month euribor futures) and short-term Japanese debt (3-month euroyen futures).
A quick explanation:
The euro/yen cross rate is fairly straight forward. An exchange rate is any currency relative to the U.S. dollar while a cross rate measures two non-dollar currencies.
When the euro/yen cross is rising it means that the euro is rising relative to the Japanese yen. When the cross is falling… the yen is obviously rising relative to the euro.
We have argued on occasion that the euro/yen cross rate has something to do with the U.S. dollar. In fact it is our contention that the reciprocal- the yen/euro cross (same relationship simply shown from an upside-down perspective)- tends to go with or lead the dollar.
The view is that changes in the euro relative to the yen involve flows of money that pass through the dollar. In other words while one may take money from Japan, buy euros, and invest in higher yielding euro-based short-term debt the process tends to indirectly pass through the dollar. The yen is sold to buy dollars and then dollars are sold to buy euros. This creates downward pressure on the yen relative to the dollar and then downward pressure on the dollar relative to the euro.
In any event… we digress. The second feature of the chart comparison at below involves the price spread between euribor and euroyen.
To keep things simple we will use round numbers. If, for example, 3-month European interest rates are 5% then euribor will have a price of 95. If 3-month Japanese interest rates are close to 0% then the price will be roughly 100.
Euribor minus euroyen in our example would be 95 minus 100 which equals -5. When European interest rates are 5% greater than similar Japanese interest rates the spread will be -5.
The chart shows that between 1999 and the start of 2009 the spread between European and Japanese interest rates was consistently 2% or greater. The spread reached 4.5% in 2000- 2001 as well as 2008.
When European interest rates are 2% to 4% higher than similar Japanese interest rates… money will flow from Japan towards Europe. As money flows from Japan towards Europe… the euro will tend to rise relative to the yen. Which is what happened.
Our argument above was that today’s situation is somewhat similar to Canada during the late 1980’s and early 1990’s. As long as the yield spread was maintained the Canadian dollar was pushed higher by ‘hot money’ flows. Once the Bank of Canada allows the yield spread to narrow the Canadian dollar fell.
The current case is similar in a somewhat convoluted manner. Instead of the Bank of Japan raising its policy yield to levels similar to the U.S. and Europe the Fed and ECB have pulled their yields down towards those of Japan. The end result, however, is a marked increase in the euribor minus euroyen spread.
So… where are we going with all of this?
Unless the Bank of Japan can find some way to take its over night interest rate below 0% the reality is that after close to ten years of capital flows from Japan to Europe to take advantage of higher returns… the spread has disappeared. In our page 1 example of the Canadian dollar it took years for the currency to rise from the low .70’s up to the cycle peak around .8900 and several years once again to return to the low .70’s.
Our view is that the euro will decline over time relative to the yen. Our view is that it may take a few years but eventually we will see the euro/yen cross all the way back to its starting point in 2000. In other words we expect to see the euro/yen cross fall to below 100 and likely down to or below 90.
The bigger point is that all of this actually has little to do with the euro and the yen and more to do with the markets that went along for the ride and, most especially, the one that was caught in the cross fire.
The rising trend for the euro against the yen defined the post-Nasdaq asset price bubble that led so many to believe that commodities had entered into a rising super-cycle price trend. The Asian/BRIC/emerging markets/commodities/commodity currency themes were created- in our view- out of the same trend that took free money from Japan and invested it in higher risk markets abroad. As the yen weakened the dollar weakened and as the dollar declined commodity prices rose and as commodity prices rose… the economies of both Japan and the U.S. suffered. Now the yen looks higher against the euro which means dollar strength and commodity price pressure.