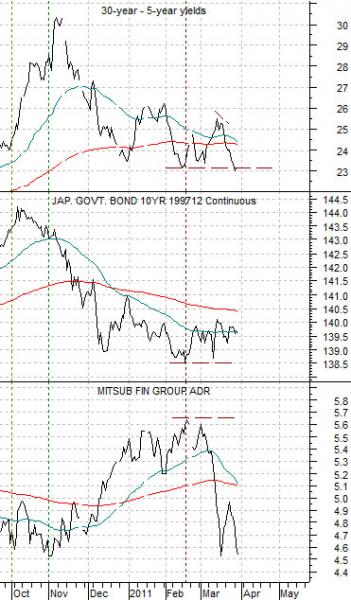
We are going to start off with a short-term perspective of a chart comparison and then shift to a long-term view on the following page.
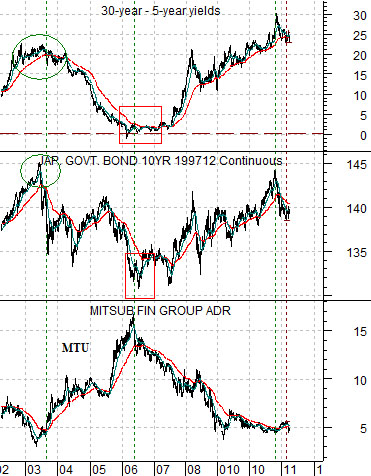
The chart below pits the yield spread between 30-year and 5-year U.S. Treasury yields against the Japanese 10-year (JGB) bond futures and the share price of Japanese bank Mitsubishi UFJ (MTU).
The long-term argument is that the laggard cyclicals- including MTU- tend to bottom when the Japanese bond market is at a price peak along with the yield spread. In other words at least some portions of the cyclical trend remain negative as long as Japanese bond prices are rising in price and the yield spread is widening.
On the face of it a widening yield spread/ steepening yield curve is a positive as it depicts the Fed’s efforts to add fuel to economic growth but in reality as long as the spread is rising it means that the cyclical trend has yet to find real traction. The key isn’t that the spread is rising but rather the point in time when it stops rising. The same is true on the other side as a flattening yield curve is a positive up until the point in time when it stops falling and starts to flatten out.
In any event… our argument is that the laggard cyclicals tend to start to rise once the yield spread begins to decline and this tends to go with the start of actual price weakness in the long end of the Japanese bond market.
Japan’s quake and tsunami gave our thesis a solid shaking but we still can’t find too many reasons that suggest that our thesis will prove ultimately to be incorrect. The Japanese bond market peaked around the start of the fourth quarter last year while the spread between 30-year and 5-year yields reached a top in early November. The idea was that this should prove to be the ‘pivot point’ for the sector that we have termed the ‘laggard banks’.
The chart shows that MTU began to rally almost exactly at the same time that the yield spread began to decline. While virtually all of the gains notched by MTU from November into February have since been obliterated the point is that the yield spread is STILL declining while the rally in Japanese bond futures prices has been little more than a pop back up towards the 200-day e.m.a. line. When all is said and done… the laggard banks have been weaker since mid-February even as the original thesis continues to grind in the expected direction.
Equity/Bond Markets
Just below we show a longer-term version of the chart included on the first page.
The argument once again was that bottoms for MTU tend to coincide with peaks in Japanese bond futures prices and the high water mark for the yield spread. The happened in 2003 and again in late 2010.
The peak for MTU, on the other hand, was supposed to line up with the low point for Japanese bond futures and a flattening or inversion of the yield spread. The last time this happened was in 2006.
The argument, we suppose, is that the current situation is very close to the exact opposite of 2006. The Japanese bond market appears to be trending lower off of a cycle peak while the yield spread is slowly beginning to flatten after a sharp rise up from the lows in 2006 and 2007.
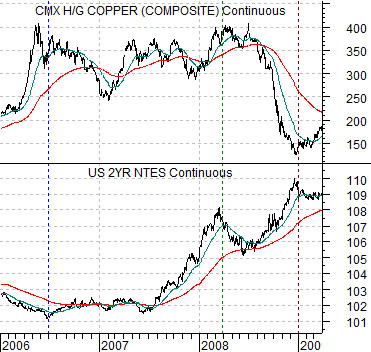
Below are two charts that may be easy to explain even if our intended message is horrendously difficult to work though. Let’s see if we can make some sense out of this.
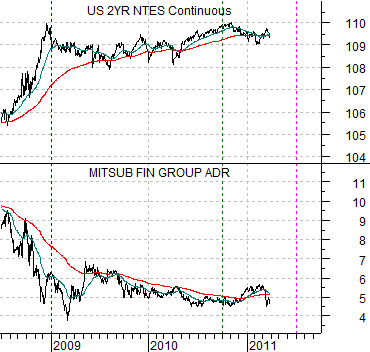
The chart below compares copper futures with U.S. 2-year T-Note futures from 2006 into 2009. The chart below right compares U.S. 2-year T-Note futures with the share price of Mitsubishi UFJ (MTU) from 2008 to the present day.
The argument is that if the current situation is close to the ‘exact opposite’ of 2006 then we need to look at the markets relationships in a similar manner.
In 2006 the 2-year T-Notes bottomed and copper prices peaked. In 2009 2-year T-Note futures peaked while the stock market and MTU hit bottom. The cyclical trend was ‘so strong’ post-2006 that it took copper futures a couple of years to actually break lower following the cycle bottom for the 2-year T-Note futures. In the current situation the cyclical trend has so much slack in it post-2008 that it has taken a couple of years following the peak for the T-Notes for the laggard banks to find some kind of positive traction.