As mentioned over the past two days one of the challenges that we face in the current markets situation is trying to discern whether ‘China growth’ is strong enough to offset ‘U.S. malaise’. In other words will the strong cyclical trend that dominated through the first six months of the year carry through into 2010 or die a painful death during the second half. Unfortunately we can make a fairly persuasive case for both outcomes which suggests to us that issue has yet to be resolved.
We are going to focus on the strong bonds and lower long-term yields argument today with the caveat that we intend to take the other side of the argument in tomorrow’s issue as we show why the bond market may continue to decline in price. Fair warning.
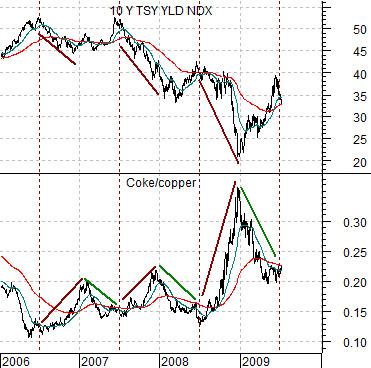
Below is a comparison between the yield index for 10-year U.S. Treasuries (TNX) and the ratio between the share price of Coca Cola (KO) and copper futures.
From 2006 through the first half of 2009 the markets have shown a very pronounced tendency to push the cyclical theme (copper) higher over the first half of the year before reversing course and favoring the defensive theme (KO). The chart shows that 10-year yields trended higher during the first two quarters and then turned lower over the final two quarters.
It is likely as difficult to buy the ‘strong bonds’ case today as it was to grasp the idea that bond price would fall at the start of the year and, we suspect, that is exactly why the idea is so compelling. The ‘hard trade’ is usually, after all, the best trade. Six months ago it seemed inconceivable that commodity prices would be driving higher and just as difficult to imagine that growth would actually push 10-year yields from just over 2% to 4%.
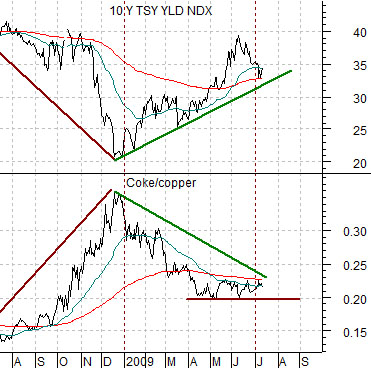
The chart below shows the 10-year yield index (TNX) and the Coke/copper ratio over the past year.
If the Coke/copper ratio turns higher- as it has done in each of the past three years- then the trend for yields should be lower. The trend break point for 10-year yields would come on a decline below around 3.25% as long as the Coke/copper ratio was resolving up towards .25. If copper held flat around 2.25 while KO rose above 55 of if KO held flat near 50 while copper moved below 2.00… the ratio would swing back above its moving average lines indicating lower long-term yields through the balance of the year.
Equity/Bond Markets
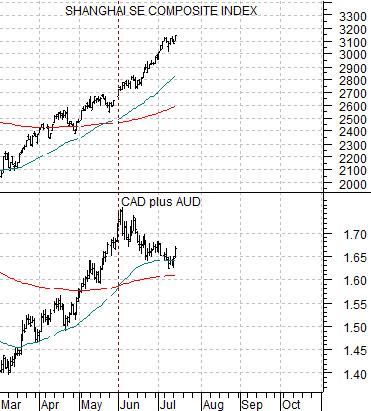
Upward pressure on long-term yields is coming from the perception or, perhaps, reality of China’s economic growth. Since the equity markets lead the economy the longer and higher the Shanghai Composite Index pushes the greater the odds that the economic ‘bulls’ are correct.
Since we started off by running the ‘lower yields’ argument we will attempt to show why the strong China trend may prove to be ephemeral.
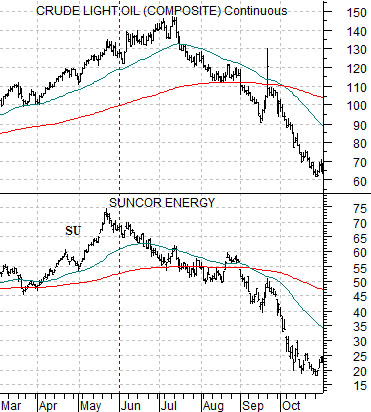
Below we compare crude oil futures and the share price of Suncor (SU) from 2008. We have every intention of showing the Suncor argument in detail but for now we will simply state that SU has tended to move very closely with crude oil prices. So closely, in fact, that the ratio tends to be almost exactly 2:1 (crude oil vs. Suncor) at key trend change points. In other words the May, 2008 peak for SU just under 75 pointed to an eventual top for crude oil a bit below 150 which was the price that the markets reached for into July of last year.
In any event… SU peaked and turned lower ahead of crude oil and at each stage of the decline the share price of SU argued that oil prices still had to move lower. Fair enough. The argument would then be that there is a market or markets that are actually leading the Shanghai Comp. Below right we show the sum of the Canadian and Australian (CAD plus AUD) dollar futures and the Shanghai Comp. The downtrend for these currencies that began in June appears somewhat similar to the way Suncor began to decline a month and a half or so ahead of oil prices last year.
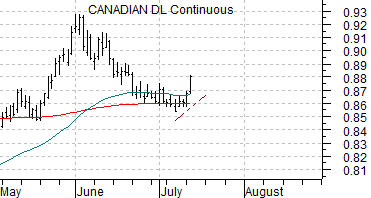
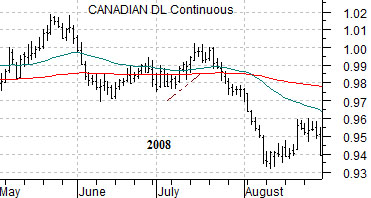
Below we compare the Canadian dollar futures from the current time period with the CAD futures from 2008. The bizarre thing- in our view- is that yesterday’s price surge is almost identical to mid-July of last year. The Cdn dollar swung up from its moving average lines and reached a peak on July 15th only to hold at that level for a week or so before turning lower once again. All told the CAD fell from parity with the U.S. dollar in mid-July down to .77 in October. The point? Cdn dollar strength this week is somewhat suspect given last year’s experience.