It all seems to come down to simple arithmetic.
The anchor to today’s argument- one that we have attempted from a number of different directions in the past- is the spread between 10-year Treasury yields and 3-month TBill yields. Over the years this spread has tended to peak just below 4%.
We grant that this time may prove to be different but each time we work through the relationship we end up with the same basic conclusion- that there are three potential near-term outcomes and only one of them is likely to prove positive.
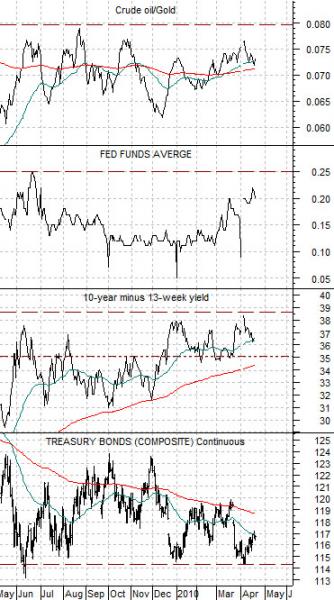
Below is a comparative chart of, from bottom to top, the U.S. 30-year T-Bond futures, the spread between 10-year and 3-month Treasury yields, the Fed funds target rate, and the ratio between crude oil and gold futures.
1) The support line for the TBond futures around the 114 level marks key support for the bond market.
2) When the TBonds decline to 114 the spread between 10-year and 3-month yields rises towards 4%.
3) The only way the TBonds can fall below 114 without the yield spread moving through 4% is if TBill yields also rise.
4) Any move above .25% by TBill yields will set into motion an increase in the Fed funds rate- likely at the next meeting.
5) Most economists seem to believe that based on the inflation rate, the unemployment rate, and the output gap there is no way that the Fed will be ready to raise the funds rate until at least 2011.
So… if the TBonds decline through 114 then the Fed funds rate will rise. If the markets are too far ahead of the economy then the potential for some kind of ‘event’ (i.e. crash) appears possible.
If the TBonds sail higher in price from current levels then the markets are ‘saying’ that growth is stalling which may also be a negative.
The only bullish outcome would be a ‘flat’ bond market with the TBonds holding above 114 while remaining below 120.

Equity/Bond Markets
We are going to take one last final run at this argument. Hopefully.
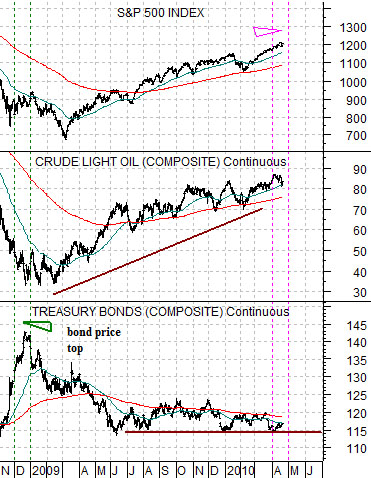
The 1987 stock market ‘crash’ may well have been the result of the collapse in oil prices towards the end of 1985. By the spring of 1986 crude oil prices bottomed as long-term bond prices reached a peak. From the spring of 1986 into the late summer of 1987 the trends reversed as crude oil and equity prices rose even as long-term bond prices declined.
If we line up the peak for bond prices in April of 1986 with the highs for the bond market in December of 2008 then April of this year would line up with August of 1987- the month that the stock market reached its peak.
The two points that we have attempted to make in recent issues are as follows:
1) The stock market did not reach its top in August of 1987 until just after crude oil prices turned lower. As long as crude oil is making new recovery highs the argument would be recovery trend remains intact.
2) The apparent ‘trigger’ for the stock market debacle was a break to new lows by the long end of the bond market. To date the TBonds are still holding above support around 114.
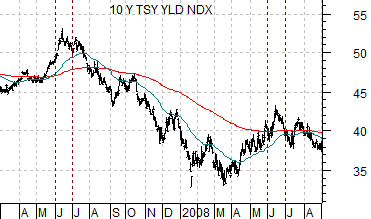
Our fixation with this topic has something to do with the recent trend for long-term yields. Below are charts of 10-year Treasury yields from 2007- 2008 and through 2009 into 2010.
In 2007, 2008, and 2009 yields rose into the month of June. If that trend persists this year then there is a definite possibility that we will see 10-year yields above 4% and the TBond futures down through 114 over the next two months.


