Sept. 28 (Bloomberg) — U.S. stocks rose, sending benchmark indexes up the most in five weeks, as takeovers in the drug and technology industries added to evidence that mergers and acquisitions are rebounding from the slowest pace in six years.
Last year commodity price weakness went with tumbling Treasury yields and collapsing stock prices so we expect that many equate commodity price pressure with lower equities. Strictly speaking this is not exactly true so we thought we would quickly run through the relationship today.
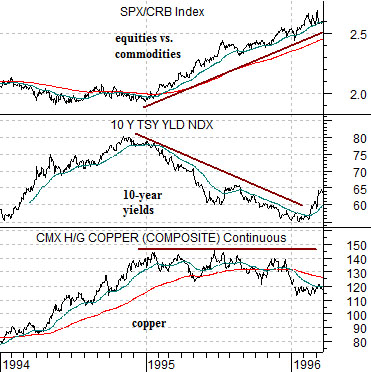
Below is a comparison between copper futures, the yield index for 10-year U.S. Treasuries, and the ratio between equities (S&P 500 Index- SPX) and commodities (CRB Index) from 1994 into 1996.
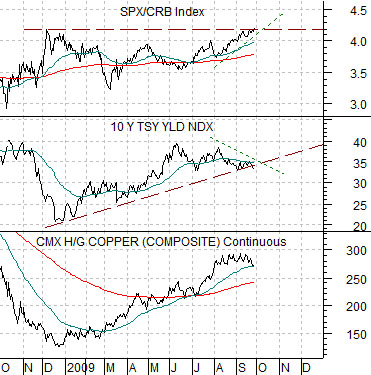
The argument begins with the observation that yields tend to trend with copper prices. When copper prices are strong and rising yields will push upwards as well. When yields are rising the ratio between equity prices and commodity prices will be pressured lower.
At the peak for copper prices in early 1995 yields turned lower while the equity/commodity ratio began to rise. The key detail, however, was that instead of collapsing copper prices simply flattened out. The equity/commodity ratio trended higher through a stable denominator (commodity prices) and a very strong numerator (equities).
We show the current situation below right. In a sense the most bullish outcome that we could imagine for the equity markets through the balance of this year and into 2010 would be a flat trend for copper prices below 3.00 and a declining trend for long-term Treasury yields. Similar to 1995 this could lead to a powerful extension of the stock market’s rally as the equity/commodity ratio lifts.
Our recurring argument has been that the consumer, pharma, and tech sectors actually have to show strength if the positive stock market trend is going to continue once commodity prices start to flatten out or weaken. In other words the markets have to get to the point where something other than BRIC-related or commodity themes are attracting capital flows which is why we found yesterday’s action so encouraging.
Equity/Bond Markets
The argument above is that when commodity prices (i.e. copper and/or crude oil) stop pushing higher yields are able to decline and when yields decline equities rise relative to commodity prices. With this in mind we will return to the two charts that we used in yesterday’s issue.
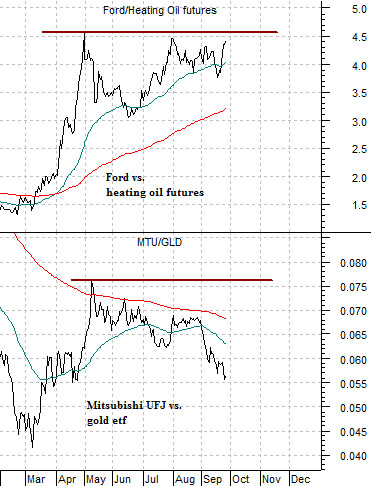
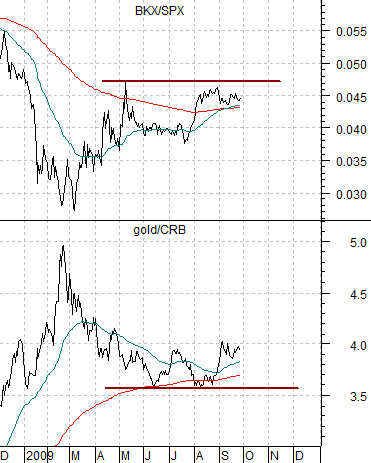
Below we show the ratio of Ford (equities) to heating oil futures (commodities) and Japan’s Mitsubishi UFJ (equities) divided by the gold etf (commodities). Below right we compare the Bank Index (BKX) divided by the S&P 500 Index (SPX) and gold divided by the CRB Index.
If energy and metals prices stop pushing upwards then yields can work lower and this tends to lead to upward pressure on a variety of equity/commodity ratios. What we are looking for at present is a clean break out to new highs by the Ford/heating oil ratio followed by a rather steep recovery in the MTU/GLD ratio.
The argument is that the banks are as weak as gold prices are strong- and vice versa. Gold prices rose relative to the CRB Index into February of this year as the Bank Index declined against the broad U.S. stock market. The stronger the banks the greater the downward pressure on gold prices. New recovery highs for the BKX/SPX ratio should go with new lows for the gold/CRB Index ratio and since the BKX/SPX ratio is almost identical to the Ford/heating oil ratio… the entire argument comes around full circle.
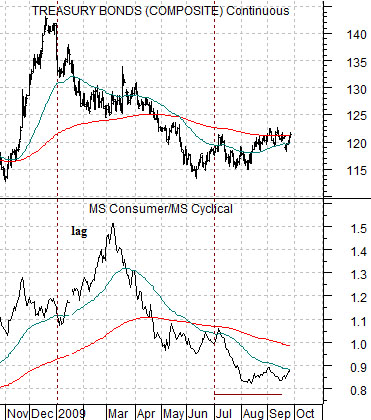
When yields decline and long-term Treasury prices rise… we expect to see the consumer/cyclical ratio rise. The twist is that it lagged the bond market by a couple of months at the start of the year (chart below) and was making new lows even as bond prices started to rise during the current quarter. The stronger the bond market the greater the odds that the consumer-oriented stocks will return to relative strength. Something sub- 3.3% for 10-year Treasury yields and over 122- 123 for the TBond futures would be appreciated.
