All things considered it has been a good time to hold a positive view on the equity markets and a negative view on bond prices.
Feb. 8 (Bloomberg) — U.S. stocks advanced, giving the Dow Jones Industrial Average its longest streak of gains since July, and shorter-term Treasuries retreated as improving retail sales and optimism in the homebuilding industry overshadowed China’s interest-rate increase.
We have also mentioned with regard to rising interest rates in China that it isn’t the first (second or third) rate hike that you have to be concerned about but rather the last rate hike. Even after three increases in interest rates since October it still appears that the one-year deposit rate is close to 2% lower than the pace of inflation for consumer goods.
The point is that the China’s central bank is still early in the credit tightening cycle. The wild card- as always- is that the markets may decide to hasten the process in some way by reversing one or more of the current trends.
In any event… we continue to fixate on the commodity currencies. In a sense the commodity currencies represent the trend that has been putting upward pressure on Chinese inflation leading to a tightening of credit.
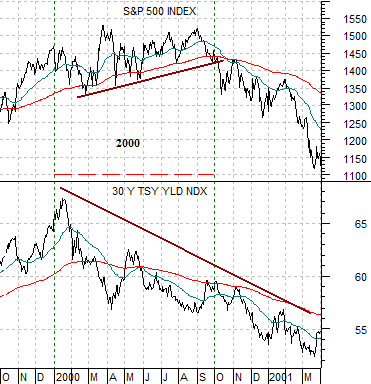
Below is a chart of the S&P 500 Index and 30-year U.S. Treasury yields from late 1999 into early 2001.
The argument is that there is often a nine month lag between initial signs of weakness and its inevitable impact on other markets. In January of 2000 long-term interest rates began to decline indicating that growth was slowing even as equity price continued to push higher into the autumn.
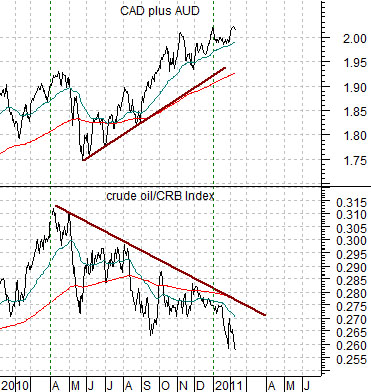
Next we show the sum of the Canadian and Australian (CAD plus AUD) dollar futures and the ratio between crude oil and the CRB Index.
Our point once again is that energy prices have been weakening on a relative basis since the start of the second quarter of 2010. The commodity currencies tend to trend with this ratio yet they have steamed higher as investors have shifted focus to non-energy commodities.
Equity/Bond Markets
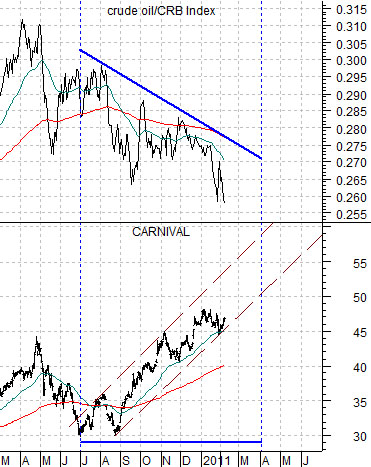
So… if the lag between weakness in the crude oil/CRB Index and the commodity currencies is supposed to be ‘9 months’ and we are now digging deeper into the month of February… is it time to set this argument aside? Perhaps. And perhaps not.
The problem is that ‘9 months’ is sort of a rough rule of thumb; the kind of lag that is easily noted in hind sight and not so easily recognized in real time.
To explain we have included a chart comparison between the crude oil/CRB Index ratio and the share price of Carnival (CCL).
CCL is an ‘energy user’ so it tends to trend inversely to the strength for energy prices. The chart shows that CCL did not start rising in price until the end of last year’s second quarter so a case could be made that we are only 7 months into the ‘lag’.
Below is our chart comparison between the Japanese 10-year (JGB) bond futures and the share price of Panasonic (PC).
This chart is full of technical ‘details’. For example we argued that the JGBs should peak and turn lower when PC moved above its 200-day e.m.a. line last October. It is also our view that trend reversals tend to occur around the time that the 50-day e.m.a. line crosses through the 200-day e.m.a. line.
The moving average lines ‘crossed’ in October with PC’s rise running out of steam in November. With the JGBs moving below the December lows yesterday we notice that PC’s share price moved higher right as the moving average lines converge. In other words if PC is in a flat or positive trend then as the moving average lines converge the share price should be set to rally and, we suspect, the most likely ‘driver’ would be a weaker yen.
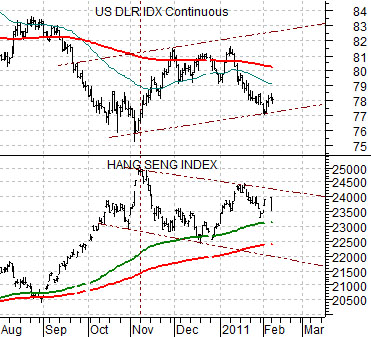
Quickly… we still think that the dollar is in a rising trend even if it appears to be working lower most days. The chart below compares the DXY with the Hang Seng Index. The Hang Seng Index still appears to be trending lower which helps to support the dollar.