We throw an awful lot against the wall on a daily basis as we plow through the various markets. Every now and then we will stumble over a potential relationship and then hammer away at it until it shows us that it is working… or not. The ‘double top’ for energy prices on a relative basis spaced one year apart is an example of an idea that appeals to us even though we can’t think of any particular reason why it should make sense.
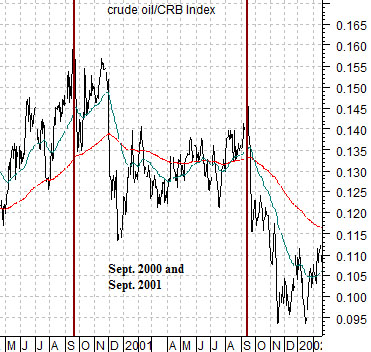
The chart below shows the ratio between crude oil and the CRB Index from 2000 into early 2002. The argument begins with the observation that the crude oil/CRB Index ratio peaked quite clearly in mid-September of 2000 as well as mid-September of 2001. In a recent issue we noted that the second top lined up almost exactly with the September 11th terrorist attacks.
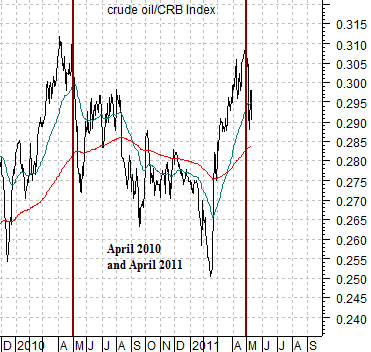
At bottom is the same chart from the end of 2009 through to the current time period.
The crude oil/CRB Index ratio made two rather obvious peaks in April of 2010 with the second taking place right at the end of the month. Our argument was that if history were to be kind enough to repeat… we should see a similar kind of top through the month of April this year with the potential for the final peak showing up right at month end. To our surprise… the ratio turned back to the down side following the death of the Osama bin Laden. Pure coincidence or not… we found that somewhat eerie.
If we assume that we have just rolled past the relative strength peak for energy prices… what happens next? In 2001 the S&P 500 Index rallied for close to 6 months from September of 2001 into March of 2002 only to continue the bear market into the last quarter of that year.
Our view is that a sharp decline in energy prices is necessary even if the initial reaction by the equity markets is bearish. The increase in gasoline costs alone represent the equivalent of a huge tax increase on consumers at a time when the U.S. housing market is struggling to find some kind of bottom. A month or two ago the U.S. Energy Information Administration reported that the average U.S. household would spend close to $700 more on gasoline that the year previous and since then gasoline prices moved substantially higher. The point? We think we are in for a period of weakness for energy prices that will likely mark a fairly major bottom for the U.S. dollar.
Equity/Bond Markets
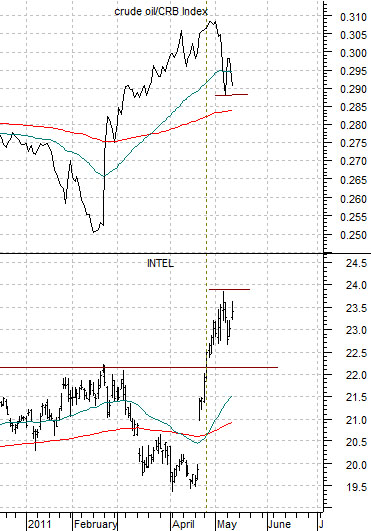
When, we wonder, does a cyclical stock become a defensive stock? The case in point, by the way, is Intel.
Intel has always been a cyclical stock. Semiconductors are the basic materials that go into ‘tech’ in the same way that copper represents an essential raw material for infrastructure and construction. Usually when the U.S. dollar is strong and rising the tech sector will outperform the basic materials and when the dollar is weak and falling the commodity sector will do better.
The problem is that in recent months Intel ‘feels’ as if it has shifted from the cyclical camp over to the defensive side of the equation. Two dividend increases over a six month period have pushed the yield on the stock well over the 3% level surpassing the yield on 10-year U.S. Treasuries.
Usually we view strength or weakness in Intel as an indication of the health of the cyclical trend but we wondered today whether we really should be lumping this stock in with themes like pharma and biotech. Chart-wise the ‘gap’ up through the moving average lines last month on positive news typically leads to a quarter or two of rising prices.
The chart below compares Intel with the crude oil/CRB Index ratio. The argument was that the break to new highs by INTC following its most recent earnings report led to a shift in the flow of money within the markets. Instead of crude oil driving higher as the tech sector weakened the theme shifted- almost over night- to a stronger trend for INTC and falling oil prices. The extension of the argument would be that as long as INTC is trending higher we could see ongoing weakness in the energy sector.
The above argument was that we could be in for five or six months of weaker oil prices. The argument from the Intel chart is that we could be in for another five or six months of a generally rising stock price. All things considered… this may represent a reasonable view how the markets are going to trend into the autumn.
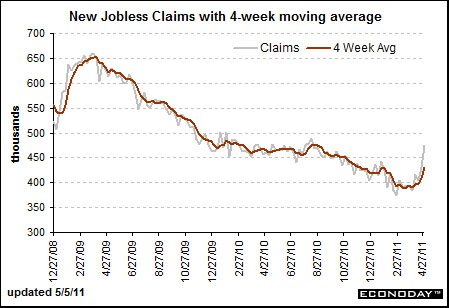
From time to time we have shown a chart from the Econoday web site of new weekly U.S. jobless claims. The idea is that this may well be the most important ‘driver’ for the financial markets.
Jobless claims peaked in March of 2009. The stock market bottomed in March of 2009. The decline in claims flattened out during the middle of 2010 and the stock market went through its more serious correction at the same time.
The point is that claims have risen sharply since March and this is putting upward pressure on the bond market and downward pressure on the cyclical themes. We get the next weekly number today and after we got a 10% hammering of oil prices last week following the release of higher-than-expected claims we are not sure what to wish for. Another strong number would pull yields lower, do some damage to the commodity markets, and quite possibly support the defensive stocks that have been outperforming of late. Whether the broad equity market could handle this kind of news without performing a swan dive is another issue entirely.