There are two sides to every trade so we might as start off today with the ‘other side’ of the argument that we have been making in recent days.
June 14 (Bloomberg) — The yield on the 10-year U.S. Treasury note will fall below 3 percent in the coming months, a level last touched in April 2009, as investors flee risk in the wake of Europe’s sovereign debt crisis, Deutsche Bank AG said.
Below is a comparison between the S&P 500 Index (SPX), the U.S. 10-year T-Note futures, and gold futures.
The view is that the markets may or may not be in a state of crisis at present. While that assertion may appear somewhat trite… the point is that there is a considerable difference between a market moving away from risk due to a transient crisis and one that is declining in response to anticipated slower growth. The former is a short-term event that typically ends with a ‘V-shaped’ bottom as bond prices decline while the latter can run for several years as bond prices resolve higher.
In recent weeks the equity markets have declined as bond and gold prices have risen. In the midst of the crisis risk-based assets like equities and commodities have been falling as sectors benefiting from the flight away from risk have risen.
The point, we suppose, is that this is a two-sided market. There are times when bonds and equities trend together but this is not likely one of them. To make the case that the inflection point for the crisis is in the rear view mirror the equity markets have to continue to resolve higher even as bond and gold prices decline.
The charts show that the SPX is currently mired just below its 200-day e.m.a. line and close to the top edge of the descending trading channel. Yesterday’s late-day give- back reflected a market- in our view- that was not quite ready to change trend as evidenced by the way the T-Note futures and gold futures are still trading some distance above their support lines.
The argument is that stronger equities require weaker bond and gold prices. If 10-year Treasury yields do decline below 3% in the coming months then the prospect of a sustained equity markets advance becomes severely diminished.

Equity/Bond Markets
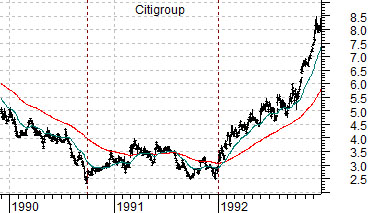
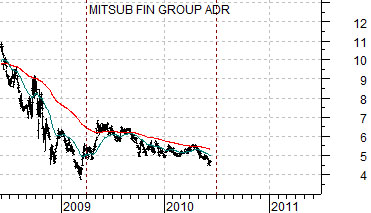
Below is a comparison between the share price of Citigroup (Citicorp at the time) between the end of 1989 through 1992. Below it we feature a chart of Japanese bank Mitsubishi UFJ (MTU) from mid-2008 forward.
The ongoing argument has been that the laggard banks for the current cycle (MTU) are dragging along the bottom in a manner similar to C between the autumn of 1990 and the end of 1991. If this proves to be true then perhaps sooner rather than later ‘something’ will change within the markets to kick the laggard banks higher.
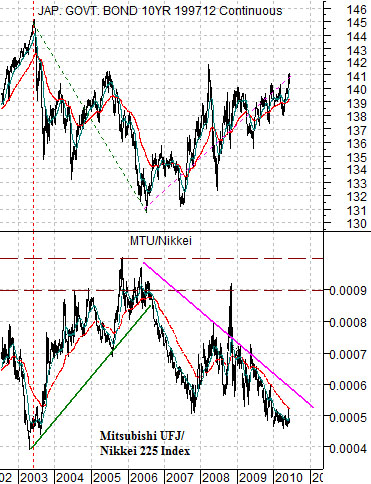
The ‘something’, in our view, has to do with the bond market. Not just the bond market but more specifically the Japanese bond market.
At bottom we show the Japanese 10-year bond (JGB) futures and the ratio between MTU and the Nikkei 225 Index. The idea is that MTU will outperform the Nikkei when bond prices are trending lower and underperform when bond price are trending higher. The chart makes the point that the trend for Japanese bond prices has actually been higher over the past four years.
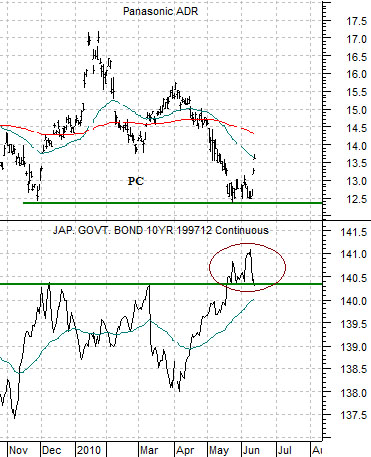
Below we compare the JGB futures with the share price of Panasonic (PC). PC, similar to many Japanese equities, tends to trend in the opposite direction of Japanese bond prices.
We are going to come back to this on page 5 today but the basic point is that strength in the laggard banks similar to the end-of-quarter upside pivot for Citigroup at the completion of 1991 will require weaker Japanese bond prices. With PC’s share price rising up from support over the past few days and the S&P 500 Index rising (page 1) to threaten the moving average line and channel top a case can be made that the Japanese bond market made some kind of top after breaking above 140.30 during the second half of May.


