The burning question at the moment is whether China’s economy can continue to drive cyclical growth through the balance of the year in a manner similar to recent end-of-decade trends or whether the tendency exhibited over the past few years of commodity-related weakness through the second half of the year will win out. If China remains strong then last week’s energy price weakness will prove to be a minor correction in a rising trend with natural gas prices swinging higher this summer as interest rates rise.
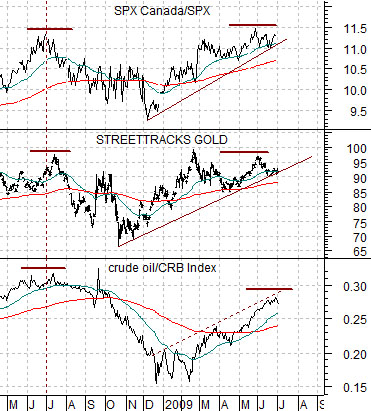
At top right we show a comparison between the ratio of the Canadian to the U.S. stock market (S&P/TSX Comp./S&P 500 Index), the gold etf (GLD), and the ratio between crude oil and the CRB Index.
The Canadian stock market does better during a strong commodity price trend and, on a relative basis, has returned to the peak set last summer when crude oil prices were pushing above 140. The recovery in this market has gone with an upward trend for gold prices, crude oil prices rising relative to general commodity prices, and higher long-term Treasury yields.
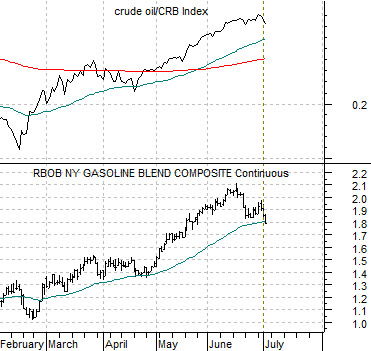
The chart below right compares the crude oil/CRB Index ratio with gasoline futures.
The argument has been that the major trend since early 1999 has favored crude oil prices and the energy sector at the expense of those sectors that use instead of produce energy. In other words the trend has been positive for the oil producers and rather intensely negative for the autos and airlines.
We have shown in past issues that the trend for the energy-users tends to lag trend changes for the crude oil/CRB Index by close to one year. The idea was that given the top for the crude oil/CRB Index ratio in mid-2008 we would see the start of a long-term positive trend for the autos and airlines developing during the second half of this year.
Given that the second half has finally arrived… the success of the argument rests with the premise that the crude oil/CRB Index is not going to grind to new highs this year and for that to happen we will need to see lower rather than higher gasoline futures prices. We would also like to see a price break down through the support line for gold prices and an end to the rising trend exhibited by the Canadian stock market.
Equity/Bond Markets
Our thesis- once again- has been that the S&P 500 Index bottomed last November and is now in a rising trend but that there would be two periods of downward pressure that would lead to lows in March and again in August. We argued that the stock market would stage a 2-month rally from March into May and then struggle- perhaps even testing the March lows- through into early August.
Given that our Big Picture equity markets view is positive our focus of late has been on showing why the equity markets are under pressure and, perhaps more importantly, what would have to happen to swing the trend back to the upside. To do this we put together three chart comparisons which we are featuring- yet again- on this page.
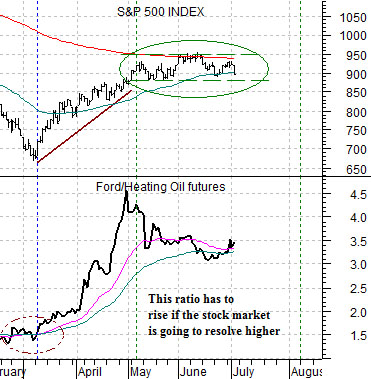
The chart at top right compares the SPX with the ratio between the share price of Ford (F) and heating oil futures. The idea is that whether energy prices rise or fall the trend for the SPX will only be positive if the F/heating oil ratio is rising. In other words if energy prices decline by, say, 20% on economic weakness and Ford’s share price falls 25%… then the equity markets are clearly not ‘positive’.
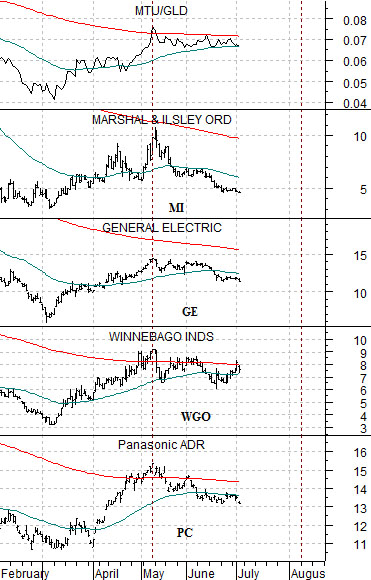
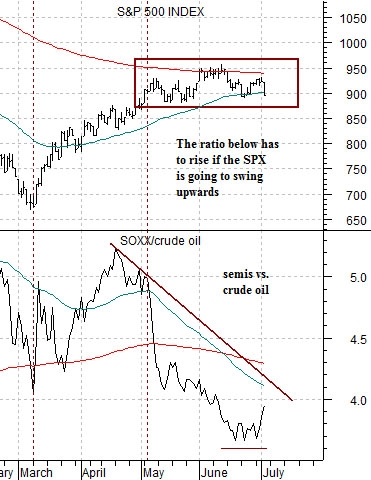
The same argument holds true for the ratio of the Philadelphia Semiconductor Index (SOX) and crude oil and the ratio between Japanese bank Mitsubishi UFJ (MTU) and the gold etf (GLD). In a strong and positive equity market the semiconductors will be stronger than crude oil and to mark the end of the macro pressures on the financial sector that began through the end of 2005 into 2006 the share price of MTU has to be stronger than gold prices. We have added a few charts to the comparison below right to show a handful of individual stocks that started to weaken in early May. Our thought is that if they continue to grind lower into August this would represent a ‘shopping list’ for new long positions.