The Federal Open Market Committee concluded its 2-day meeting with the usual dollop of Fed-speak. The markets sold off somewhat in response before hunkering down once in front of whatever decisions the European Central Bank might make today. From our perspective the weekly jobless claims report is probably of greater importance as a decline below 350,000 will help to provide the kind of traction that will lead to a declining U.S. unemployment rate.
Given that the markets are stuck in ‘news limbo’ we thought that we would shift over to one of our macro arguments. While we won’t get to the eventual point until page 3 the conclusion is actually remarkably bullish. So… here goes.
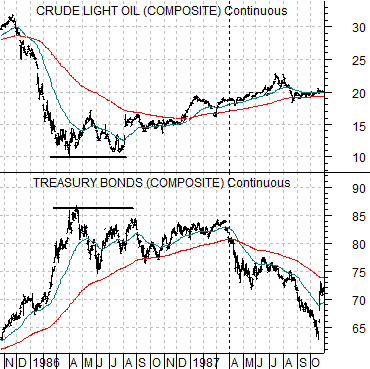
First is a chart of crude oil futures and the U.S. 30-year T-Bond futures from 1985 into the autumn of 1987.
We are showing crude oil AND bonds to help explain both why and when bond prices peaked and eventually turned lower in 1986- 87. Bond prices rose as an offset to falling oil prices into the spring of 1986, held close to the highs into 1987, and then turned back to the down side in the second quarter of 1987 as rising oil prices drove the cyclical trend upwards.
Perhaps the most significant event of 1987 was the stock markets ‘crash’ in October but that had less to do with cyclical strength or weakness than it had to do with an unsustainable divergence in prices.
While a stock market ‘crash’ is bound to create a sense of panic it was likely eclipsed by the frantic rush of economists to the microphones to proclaim the start of an economic depression. After all… that was the lesson learned from 1929.
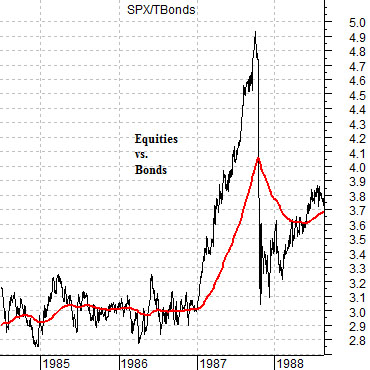
The next chart shows the ratio between the S&P 500 Index and the U.S. 30-year T-Bond futures. What we eventually discovered post-1987 was that economic growth continued to chug forward. Collapsing stock prices did not forecast a depression but were the result of the combination of rapidly rising stock prices and equally rapidly declining bond prices that pushed the stock/bond ratio too high too fast. Once the ratio came back to more sustainable levels prices steadied out with the bull market continuing at a somewhat steadier pace.
Equity/Bond Markets
The above argument was that the 1987 stock market crash was, by and large, a monetary event that had little to do with cyclical growth. It represented one piece of a sequence that began as oil prices collapsed in 1985 sending bond prices higher. As oil prices began to strengthen the bond market flattened out and then turned lower. Money poured from the bond market into risk-based assets creating an amazing ‘bubble’ in the ratio between equities and bonds. The further the bond market declined the wilder the divergence until eventually stocks ‘crashed’ and bonds ‘bounced’.
Yet… there was no depression. Or recession.
All of this brings us back to the argument surrounding the 2-year lag.
The 2-year lag suggests that changes in interest rates today impact cyclical growth two years hence. Cyclical growth today is being driven by the trend for interest rates two years in the past.
This is one of the more elegant and confusing arguments that we make. The bond market trends inversely to cyclical growth in real time while also impacting cyclical growth with a 2-year lag.
To explain… on page 1 we showed crude oil futures and the TBond futures. Notice that bond prices rose in response to falling oil prices and then turned lower as oil prices recovered. This is an example of the bond market reacting in real time to cyclical pressures.
So… why did economic activity continue to push forward? The answer lies with the 2-year lag.
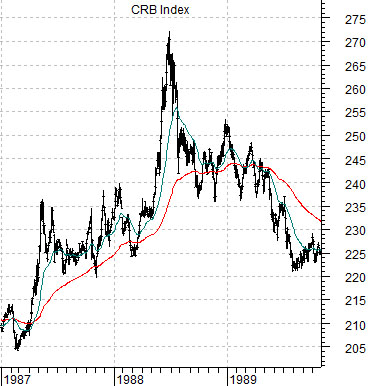
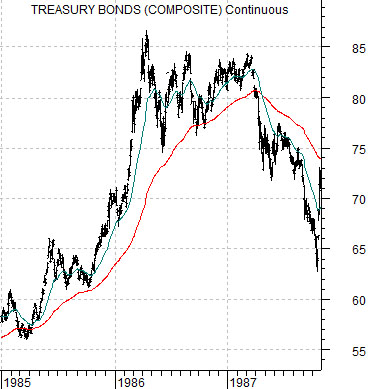
Below is a chart of the CRB Index from 1987- 89 Below right we show the U.S. 30-year T-Bond futures from 1985- 87.
The charts have been set up with a time difference of two years so that the trend for the CRB Index in, say, 1987 is lined up with the bond market in 1985.
The frantic rise in cyclical asset prices in 1987 was an extension of the equally frantic rise in bond prices in 1985. Bond prices peaked in 1986 while the CRB Index did not reach a top until 1988.
The down turn for bond prices in 1987 forecast a return to a more negative cyclical trend in 1989. The weakening trend eventually led to the peak for Japanese asset prices at the end of that year and, as growth slowed, the U.S. equity bear market in 1990 that preceded the collapse of real estate prices and huge concurrent stresses on the banking system in 1991- 92.
The key here is that the bond market works off of cyclical growth in two different time frames. It rises and falls in real time in response to economic strength and weakness while impacting growth with a lag of two years. If this seems strange consider that the Fed began to ease credit at the start of 2001 with cyclical asset prices turning higher in 2003. The Fed began to tighten credit in 2004 with economically sensitive markets like Japan and copper reaching price peaks in 2006.