We are going to slow the pace somewhat today. We often jump from topic to topic quite quickly simply because after years and years of writing this letter we often make the mistaken assumption that relationships that seem obvious to us are actually obvious to anyone else.
Our intention is to work fairly methodically through a series of relationships that we are using to help establish where we are in the current cycle. The purpose in doing this at a more leisurely pace is that… this is important. Our hope is that we can explain either why we are right or show exactly where we are going to be wrong.
Our theses are as follows. First, we like the banks and Japan. Second, we believe that even if we are wrong today we will be right a few months or quarters from now. Third, since both Japan and the banks are ‘cyclical’ for this to work interest rates have to rise. Fourth, the major ‘driver’ for yields so far has been strong copper prices. Fifth, recent energy price strength is, by and large, the markets’ way of trying to make us look even more stupid than usual.
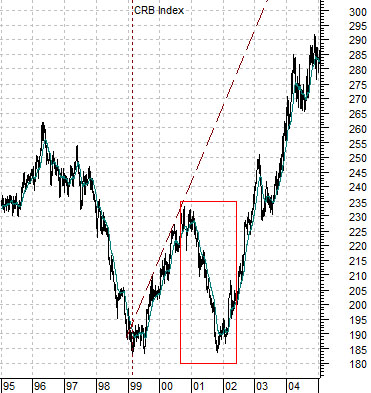
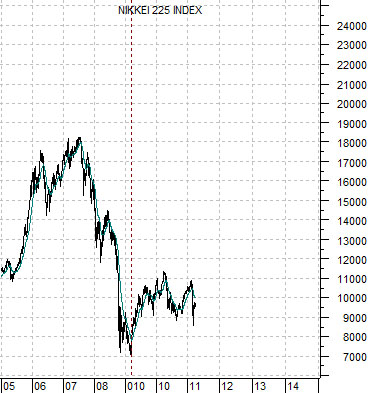
Below we have included a chart of the CRB Index from 1995 through 2004. Below right is a chart of the Japanese stock market (Nikkei 225 Index) from 2005 to the present day.
The argument here is that the Nikkei peaked 10 years AFTER the commodity markets (in 1990 versus 1980) and that the trend for the Nikkei through the previous decade was almost identical to the trend for the CRB Index during the 1990’s. In other words… the Nikkei is trailing the commodity markets by a decade.
Since the CRB Index began to trend higher after making a major cycle bottom in the first quarter of 1999 our view was that the Nikkei’s low in the first quarter of 2009 marked ‘the bottom’.
The problem is that the CRB Index circled back through 2001 to retest the lows so if we take the comparison literally the Japanese equity market could remain bearish for another nine months. From an intermarket perspective… this is the problem that we are struggling with. On the one hand the bullish commodity trend began in 1999 while on the other hand prices traded lower all through 2001. While we have argued that all this did was push the beach ball so far under the water than when the pressures finally eased the commodity markets exploded to the upside it is still an issue that we have to find some way to address.
Equity/Bond Markets
Our first point was that the CRB Index bottomed in the first quarter of 1999 while the Nikkei bottomed ten years later in the first quarter of 2009.
The second point was that the CRB Index traded lower through 2001 and then exploded to the upside as prices raced to catch up with a trend that had turned positive almost three years previous.
We should note that when a market has been pressured lower even when the underlying trend is higher… when the pressures abate you tend to get a relentless rise in prices. This, by the way, is one of the reasons why we rarely use overbought and oversold indicators. A market coming back ‘on trend’ will get overbought and stay overbought for a long time.
In any event… back to our stream of consciousness.
Our view is that the CRB Index turned positive in 1999 but was pressured lower through 2001. What exactly was acting as pressure on commodity prices? The U.S. dollar.
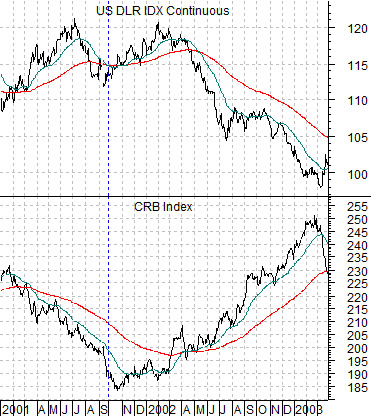
The chart just below compares the CRB Index with the U.S. Dollar Index from 2001 into 2003.
The first point is that the CRB Index was declining because… the U.S. was in recession post-Nasdaq bubble and the dollar was continuing to rise. If you get a weaker U.S. economy AND a strong dollar chances are that commodity prices will decline.
However… the reality is that the commodity price trend was already bullish. Not because of the weaker U.S. economy but because we were in the early stages of a China-driven capital spending trend. As capital spending collapsed in the U.S. to be replaced eventually by housing price-driven consumer spending the Asian trend shifted back to capital spending.
The point that we are trying to explain is that the base trend for commodity prices was higher even as capital continued to flow into the dollar which, in turn, pressured commodity prices temporarily lower.
Now… we could argue that the CRB Index finally began to rise in the autumn of 2001 in response to a weaker dollar but that would be incorrect. The dollar began to decline about six months AFTER the CRB Index turned higher.
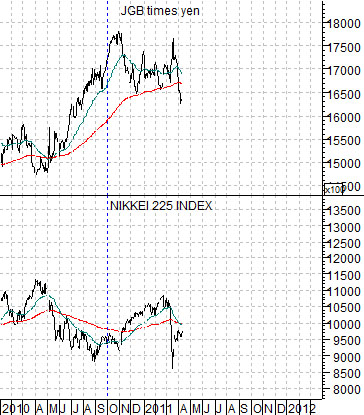
Below is a chart of the Nikkei 225 Index and the combination of the Japanese 10-year bond futures (JGB) and Japanese yen.
While commodity prices tend to weaken when the dollar is stronger the argument is that the Nikkei tends to weaken when the Japanese bond market OR the Japanese yen is stronger. We could make the case using one or the other but we prefer to use a combination of both.
The argument that we have been circling goes something like this. It may be that the Nikkei will remain weaker through 2011 but the view is that it turned bullish way back in 2009. We have no way of knowing whether the trend is going to remain under pressure for another month or, potentially, in the autumn of this year in a manner similar to the CRB Index in 2001.