We are going to take another swing at the argument that we put forth earlier this week. To cut to the chase… the idea is that a case can be made for an extremely strong third quarter with the banking shares leading the charge.
We have argued that trends tend to run quarter to quarter with new trends developing through the first month of a quarter. We mention this once again because it is still somewhat early in July to suggest that a clear trend has begun. We remain in pre-earnings confusion to some extent as the markets focus on what happened last quarter instead of fixating on how business and profits are faring at the present time.
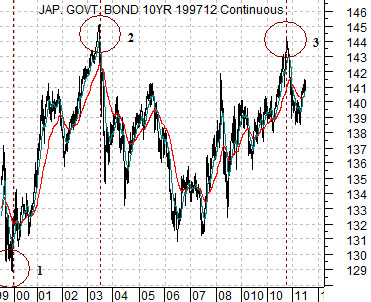
First is a chart of the Japanese 10-year (JGB) bond futures. This is a fairly good place to start.
Our focus is on the three circled chart points. The first marks the bond price lows at the end of 1999. The second equates to the bond price highs in mid-2003 while the third involves the peak for the JGBs in the autumn of last year.
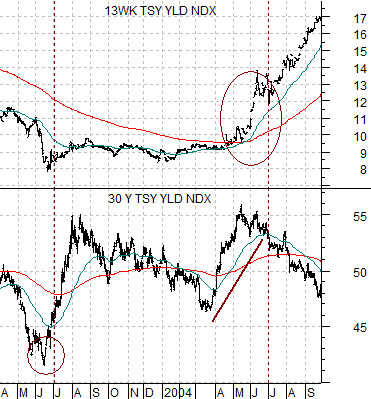
We are now going to shift from Japanese bond prices to U.S. bond yields keeping in mind that a peak for prices goes with a bottom for yields and vice versa.
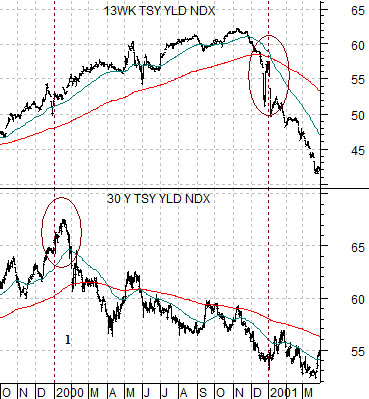
Next is a comparison between U.S. 30-year Treasury yields and U.S. 3-month TBill yields from late 1999 through the first quarter of 2001.
The low point for Japanese bond prices was reached at the end of 1999. The peak for 30-year U.S. Treasury yields was made in January of 2000. Fair enough.
The argument is that long-term yields peaked in January of 2000 while short-term yields started to decline close to a year later towards the end of 2000. In between the peak for long-term yields and the start of the decline for short-term yields the markets began the process of weakening asset prices. In other words initial weakness was indicated by falling long-term yields, the trend was confirmed by a bearish trend for asset prices (copper, crude oil, equities, etc.) with the tail end of the sequence showing up through the collapse of short-term yields towards year end.
Equity/Bond Markets
The chart below features U.S. 30-year Treasury yields and 3-month TBill yields from 2003 into 2004. This is the second point in time highlighted on the Japanese bond futures chart on page 1.
Japanese bond futures peaked in mid-2003. U.S. 30-year yields bottomed in mid-2003.
The sequence is very similar to the year 2000… only in reverse. Long-term yields bottomed around the end of the second quarter in 2003 while short-term yields accelerated to the upside during the second quarter of 2004. There was a one-year gap between the bottom for long-term yields in 2003 and the first Fed rate hike in June of 2004.
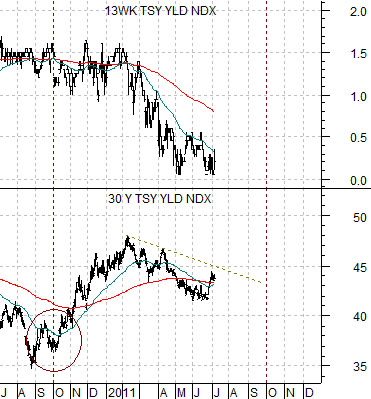
Now let’s shift our attention to the current situation. Below right is a comparison between 30-year and 3-month yields from 2010 into 2011.
The argument was that Japanese 10-year bond prices peaked in the autumn of last year and this went with a low for long-term U.S. yields. The idea is that we could be 9 months into a trend change similar to 2003- 2004.
For this to work we would expect to see a return to upward pressure on long-term yields in a manner reminiscent of April, May, and June of 2004 with fairly significant upward pressure developing for short-term yields.
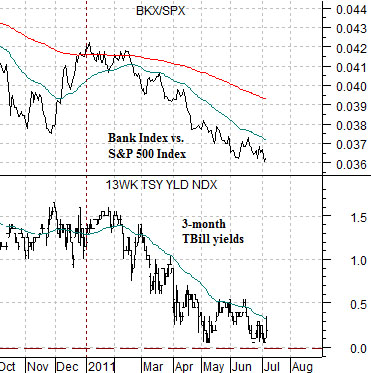
The problem is that short-term yields have actually been trending lower. Below is a comparative view of U.S. 3-month TBill yields and the ratio between the Bank Index (BKX) and S&P 500 Index (SPX).
So… how do we get from here to there? What would have to happen over the next three months to create the kind of upward pressure on TBill yields that seems to occur 12 months after the start of a rising trend for long-term yields? Our thought is that the only way that this can work is through a rather furious period of strength for the Bank Index.