We have developed something of a distrust for Tuesdays. Over the past four or five years our observation has been that markets have a tendency to go ‘counter trend’ on Tuesdays. We have never bothered to keep any data on the subject and, for all we know, this may be pure coincidence mixed in with a mental bias but… when an ongoing trend backs up over top of the market on a Tuesday we tend to dismiss its validity. One of these days this might prove to be a mistake.
The Japanese yen rose to new all time highs against the U.S. dollar yesterday. We have commented on many occasions that the flight to safety markets included the bond market, gold, Swiss franc, and Japanese yen. With the bond market, gold, and franc well off of their recent peaks the yen became the final shoe left to drop.
The problem is that the longer the yen keeps pushing the weaker the case becomes for a clear pivot into a recovering trend. This is, by the way, one of the reasons we mentioned the potential for a ‘lag’ for certain markets once long-term yields began to rise in yesterday’s issue.
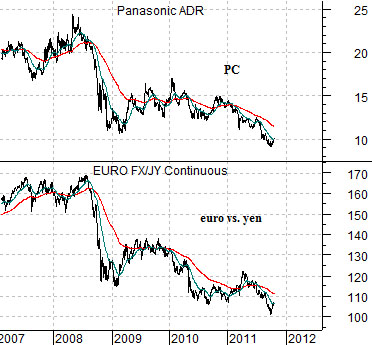
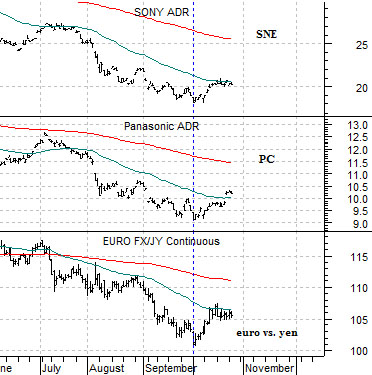
In any event… at top right we have included a chart of the share price of Panasonic (PC) and the cross rate between the euro and the yen.
The cross rate shows that the euro has been weakening against the yen since 2008. This was, of course, the last time that Japanese consumer product maker Panasonic made a significant price top. The charts suggest that there is a broad relationship- causal or otherwise- between Japan’s large cap export-based consumer products companies and the strength of the yen against both the dollar and the euro.
Below we snug up the perspective somewhat while also including a chart of Sony (SNE). Our point here is that we are using Panasonic to represent a fairly broad investment theme.
The general health of the Japanese stock market appears to be very closely tied in with the strength or weakness of the Japanese yen with a particular emphasis on the cross rate with the euro. If we get to the point where the markets stop pushing money towards the yen while becoming more comfortable with the euro then a case can be made for a much better trend for some of the world’s largest and most recognizable consumer discretionary names.
Equity/Bond Markets
Frankly… we expected a bit more imagination and inspiration from the markets. What we have seen so far, however, is a replay of last year’s recovery sequence.
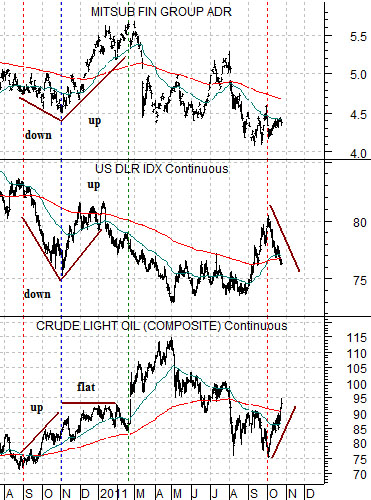
Just below is a rather confusing comparison between crude oil futures, the U.S. Dollar Index (DXY) futures, and Japanese bank Mitsubishi UFJ (MTU).
The recovery off the autumn lows in 2010 was initiated by a weaker dollar. Through September and October the dollar declined and crude oil prices rose. From there the dollar started to strengthen creating a spreading out of the recovery to the laggard banks (MTU). The sequence began with a falling dollar and rising oil prices before shifting to a stronger dollar and rising bank share prices.
Through the month of October the markets have essentially repeated this sequence as dollar weakness has helped lift the energy theme. Eventually the dollar will find a bottom which will lead to a flatter trend for crude oil and a rotation over to the laggard banks.
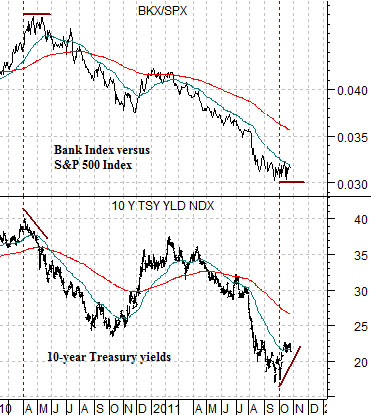
Below is a chart of 10-year Treasury yields and the ratio between the Bank Index (BKX) and S&P 500 Index (SPX).
The arguments are that the BKX/SPX trends with yields and… at key turning points may lag somewhat. When yields started to decline in the spring of 2010 the BKX/SPX held near the highs into May. If yields are now turning higher then it may bounce around near the lows into November.
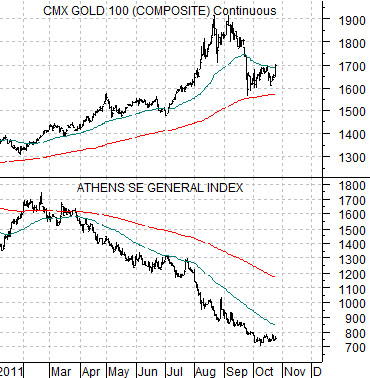
Last chart below features gold futures and the Greek stock market (Athens Stock Exchange General Index).
Gold prices moved briskly higher yesterday. One of the keys for lower gold prices should be a better trend for Greece’s equity market. The index hasn’t made new lows for a few weeks but it most certainly has not shown much in the way of strength.