While we are all familiar with the saying that the ‘trend is your friend’ the odd thing about trends is that they are quite often difficult to discern until they have run for a few years. In hindsight, of course, the trend is always obvious but in real time… not so much.
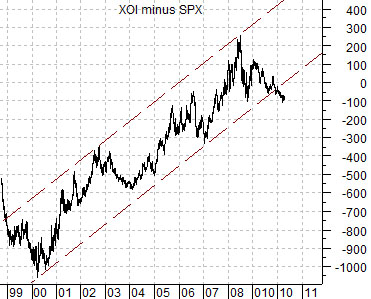
Below is a chart showing the spread or difference between the Amex Oil Index (XOI) and the S&P 500 Index (SPX) from late 1998 through to the present day.
At the peak for the SPX and Nasdaq in 2000 the XOI was more than 1000 points lower than the SPX. In 2008 the XOI had risen to more than 200 points higher for a total swing of more than 1200 points. Given that the S&P 500 Index is currently around 1200… a swing of that magnitude is significant.
The point is that from 1999- 2000 into 2008- 2009 the oil stocks outperformed the broad market as the trend favored the energy sector.
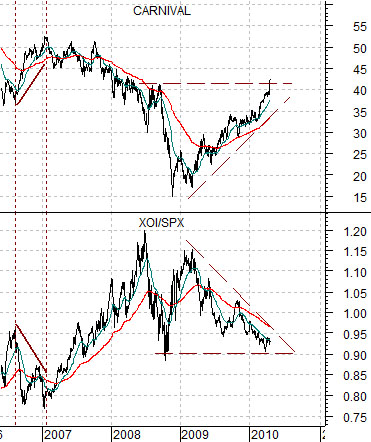
Below we show another spin on the XOI versus SPX argument using a ratio of the two indices. The chart compares the XOI/SPX ratio with the share price of cruise ship operator Carnival (CCL).
We have used CCL as a surrogate for the energy ‘using’ cyclical sector simply because the barriers to entry are quite high and- unlike many of the airlines and most of the autos- imminent bankruptcy was not an issue.
When rising energy prices represent ‘the trend’ then times become tough for cyclical companies with heavy fuel bills. Between 2005 and 2008 the markets opened the window for a counter-trend rally for roughly a six month period during the second half of 2006. In other words the oil stocks represented long-term ‘buy and holds’ while the autos, airlines, and cruise ships trended lower with the exception of a small six month window while the oils took a breather.
What is the trend today? Even as crude oil prices rise the ratio of the oils to the broad market keeps falling. As a result the share price of Carnival continues to set new recovery highs on virtually a daily basis suggesting that the trend truly is your friend if you can merely figure out what in the heck it is.
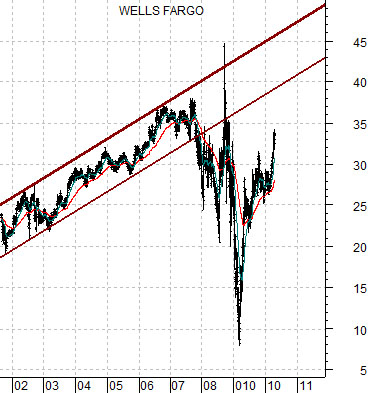
Below is a chart of Wells Fargo (WFC). The channel lines drawn on the chart represent an exercise in imagination.
When a stock drives higher or lower it usually means that it is returning ‘on trend’. A market or stock can be pushed off of the trend for months or even years but when the pressures abate the subsequent return is usually quite powerful. Parabolic rises, price gaps, and ridiculously overbought technical conditions are generally symptomatic of a security that has somewhere to go.
The rising channel lines for WFC represent one explanation for the steady price rise. The interpretation would be that WFC will continue to push until the share price gets back into the 40- 45 range.
One of our recurring themes over the past while has been positive on the banks and negative on gold. The banks are doing quite well even though gold prices have yet to seriously weaken.
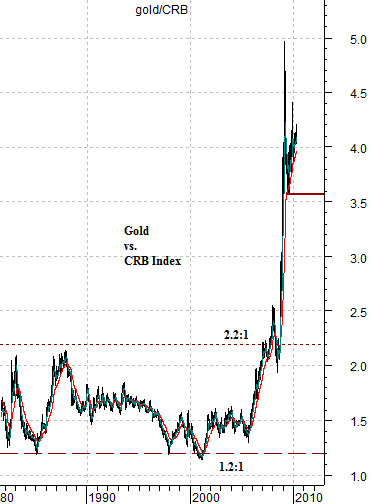
The chart further below shows the ratio of gold to the CRB Index. It could be that the gold/CRB Index ratio’s ascent was simply a function of a market coming back ‘on trend’ after years of central bank gold sales and investor disdain. It could be that the gold bulls were right- that gold prices were being held at artificially low levels. However, our view is that if WFC continues to trend higher then a case can be made for a much lower gold/CRB Index ratio in the days to come. In other words if WFC rises back to 40- 45 then it is possible that the gold/CRB Index ratio will resolve back towards its historical trading range.
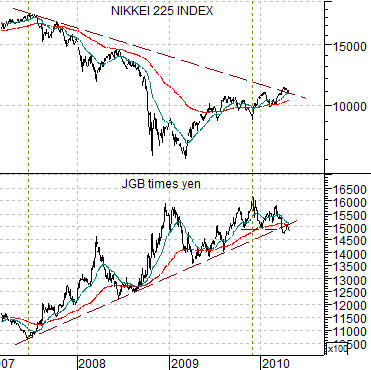
Lastly is a comparison between the Nikkei 225 Index and the combination of the Japanese 10-year bond futures (JGBs) times the Japanese yen. The argument has been that as the U.S. real estate market began to weaken in 2007 money headed in three directions in search of safety- towards gold, the Japanese yen (and U.S. dollar), and the bond market. As long as the Nikkei was trending lower and the product of the JGBs times the yen was trending higher… a solid case could be made for rising gold prices. Such is not the case at present however.
