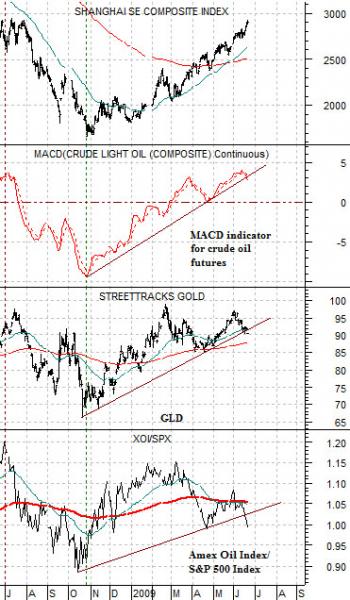
We start out today with a chart comparison of China’s Shanghai Composite Index, a technical indicator (MACD) for crude oil futures, the gold etf (GLD), and the ratio between the Amex Oil Index (XOI) and the S&P 500 Index (SPX).
The basic argument is that all four of these markets or indicators are part of the same theme that turned positive during the fourth quarter of 2008. The Chinese stock market bottomed and turned upwards, the technical position for crude oil futures prices began to improve even as prices remained under pressure through into March, the trend for gold swung upwards, and the major oil shares began to outperform the broad U.S. stock market.
The next point would be that as long as all four of these markets are pushing upwards then it makes little in the way of sense to believe that the trend is set to change. On the other hand… if one or more of these markets starts to roll over or break down then it is time to start paying attention.
The MACD indicator for crude oil futures made a top in late March along with the gold etf and the XOI/SPX ratio but after declining through most of the month of April all three turned back to the upside. The one market that showed little in the way of weakness through April was the Shanghai Composite Index as it pushed on to new recovery highs towards the end of that month.
The argument that we are attempting to make would be that over the past two weeks the oil stocks have declined fairly significantly against the broad U.S. stock market, the technical condition for crude oil futures has finally begun to weaken somewhat, and, as of yesterday, the gold etf has broken trend line support. However… until the Shanghai Composite Index weakens to the point where the 2500 level is put in jeopardy it remains difficult to argue with any conviction that the recovery trend has come to an end.
Along the way we would also like to see the XOI/SPX ratio decline well below the 1:1 level which, the charts suggest, is the rough equivalent of something in the mid-800’s for gold prices.
Equity/Bond Markets
We argued in favor of the consumer and pharma sectors over the past year or three because it was our view that once commodity prices peaked and turned lower these sectors should act as an ‘offset’. In general a rising trend for the consumer sectors tends to occur when commodity prices are trending flat to lower.
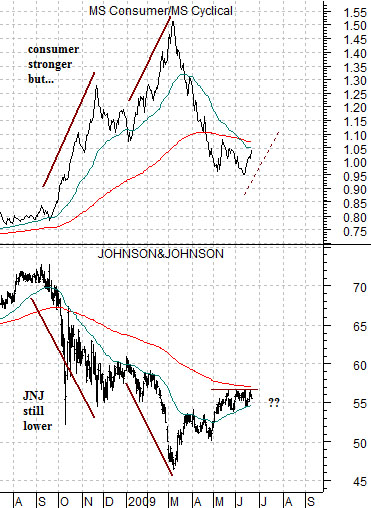
The problem that we faced last year can be seen on the chart at right. The chart compares the ratio between the Morgan Stanley Consumer Index (CMR) and the Morgan Stanley Cylical Index (CYC) with the share price of Johnson and Johnson (JNJ).
The Consumer Index includes names such as Wal Mart, Coca Cola, Merck, McDonalds, JNJ, and even Carnival Cruise Lines while the Cyclical Index features everything from Alcoa to Dupont, Citigroup to Ford, and Ingersol Rand to Deere.
The argument was that the consumer/cyclical ratio should rise as the consumer stocks outperform the cyclical stocks. Fair enough.
The argument was that as commodity prices turned lower this would result in rising share prices for the large cap consumer defensive stocks. Not so fair enough.
The consumer/cyclical index rose through the fourth quarter of 2008 and again during the first quarter of 2009 and in both instances the share price of JNJ actually declined. The thesis was that the broad stock market would be supported by strength in the defensive stocks even as the cyclicals weakened. Instead of rising in price, however, the consumer names outperformed by falling at a slower pace which helped pull the S&P 500 Index down from over 1500 to under 700.
The question at the moment is… if the cyclical recovery that began to form during the final quarter of last year (China, copper, gold, crude oil, etc.) turns negative and the consumer/cyclical ratio pushes back to the upside… will the large cap consumer stocks finally rise as an offset or will they weaken in a manner that will help sling shot the SPX back towards the March lows?
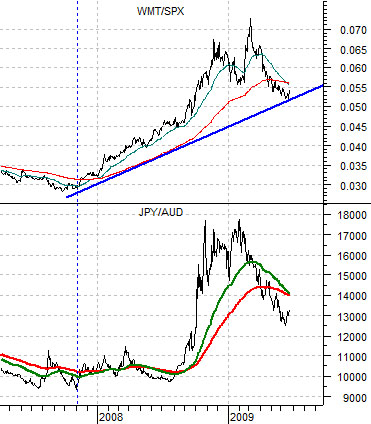
Below right we show the ratio between Wal Mart (WMT) and the SPX along with the cross rate between the Japanese yen (JPY) and the Australian dollar (AUD) futures.
The argument is that the WMT/SPX ratio and the JPY/AUD cross rate are part of the same trend. When both are rising it means that the Asian theme that tends to drive energy and metals prices is weaker.
If the XOI/SPX ratio shown in page 1 continues to decline below 1:1 pressuring gold prices back towards the mid-800’s while adding pressure to crude oil prices with the Shanghai Composite Index turning lower on the way back towards 2500… then we would expect to see WMT outperforming the broad U.S. stock market while the Japanese yen rises against virtually all currencies.
In trading yesterday both the yen and WMT were higher so while we can not say with certainty that the trend has changed it is our view that when it does so it will lead to a string of days that will broadly resemble the way this week started off.