From Bloomberg.com yesterday, ‘U.S. stocks advanced, rebounding from yesterday’s selloff, as optimism about the housing market tempered concern about a worsening of Europe’s debt crisis.’
With the U.S. dollar strengthening the U.S. large cap stocks will tend to outperform most other markets. While the markets alternate between strength from an improving U.S. economy and weakness due to Eurozone concerns the basic point is that the U.S. large cap stocks- with an emphasis on the non-cyclical names- continue to show relative strength.
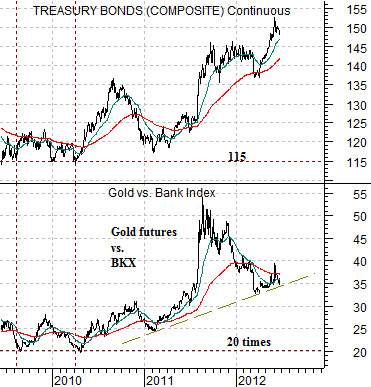
Just below is a chart comparison between the U.S. 30-year T-Bond futures and the ratio between gold futures and the Bank Index (BKX).
The greater the pressure on the banks (BKX) the stronger the trend for both long-term Treasury prices and gold. The stronger the recovery for the banks the greater the downward pressure on long-term Treasuries and gold. In other words… when the markets focus on the positives gold and bond prices decline. When the markets shift back into crisis mode… bond and gold prices rise.
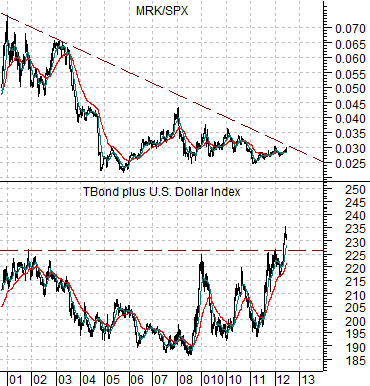
Next is a comparative view between the ratio of Merck (MRK) to the S&P 500 Index (SPX) and the sum of the U.S. 30-year T-Bond futures and U.S. Dollar Index (DXY) futures.
The MRK/SPX ratio represents the relative strength of the large cap pharma stocks. After more than a decade of weakness are the markets ready to get back into the pharma sector?
The sum of the TBond and dollar represents a certain kind of trend. Strength in bond prices goes with pressure on cyclical growth. Strength for the dollar represents money moving away from the smaller markets and back towards the U.S. in search of either less risk or higher returns.
When the TBond and dollar are moving higher the defensive large cap stocks tend to outperform. As long as this sum moves upwards the tendency will be for the MRK/SPX ratio to strengthen.
The question is… now what? Even ‘new highs’ for the sum of the TBond and dollar has not been enough- so far- to push the MRK/SPX ratio higher. Will this change later this week once the Supreme Court releases its health care ruling?
Equity/Bond Markets
We are going to take another run at a topic that we introduced yesterday. The idea is based on the position of the Canadian bond futures relative to its long-term trading channel. The chart that this is taken from has been included on page 7.
The Canadian bond futures have traded within a fairly well defined channel since being introduced in 1989. The futures contract have risen to the channel top on 3 occasions- once at the very beginning of 1994 and twice during 1998.
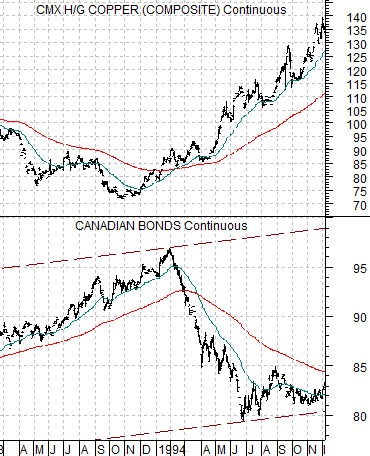
Below is the Canadian bond futures along with copper futures from 1993- 94.
The test of the channel top for Canadian bond prices went with the start of a significant price rally for copper through 1994.
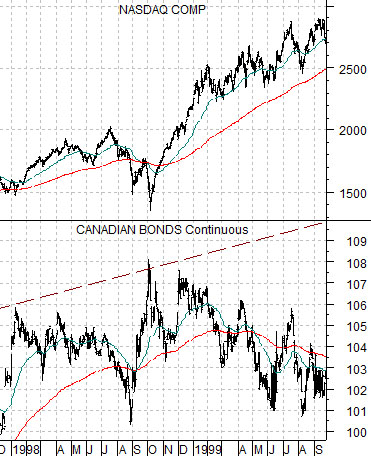
Next we show the Cdn bond futures from 1998- 99 along with the Nasdaq Composite Index.
The two tests of the channel top in 1998 went with the lows for the tech sector (Nasdaq).
So… in both 1994 and 1998 a trend that pushed the Canadian bond futures to the top of the trading channel also marked the low point for the cyclical trend (copper and tech).
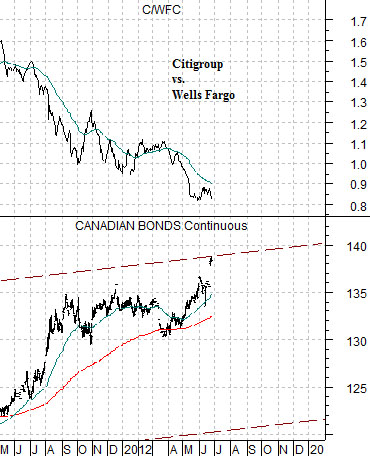
The current situation is featured below. The Canadian bond futures are once again ‘channel top’ and our view is that the offset to bond price weakness at some future date will be strength in the banking stocks.