We launched into a new argument yesterday based on the long-term ratio between Japanese and U.S. 10-year bond futures. The idea was that the major trend between 1990 and 2000 included falling Japanese interest rates relative to U.S. interest rates while natural gas prices rose compared to crude oil prices. Following the Nasdaq’s peak in early 2000 the trend reversed course with crude oil strengthening relative to natural gas and U.S. interest rates moving down towards similar Japanese levels.
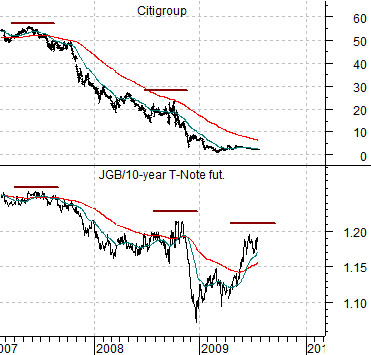
Given the decade-long nature of this trend we suspect that we are entering into the final stage. Our thought was that while crude oil was trading at close to the highest ratio compared to natural gas since 1990 there was still one more shoe left to drop with regard to the bond market. If the trend remains intact then we would expect to see the ratio between 10-year Japanese (JGB) futures and 10-year U.S. T-Note futures decline to somewhere around 1.05:1. With the JGBs currently around 138 and the T-Notes closer to 116… the most logical outcome would be a fairly steep rally for long-term Treasury prices.
The chart below compares the share price of Citigroup (C) with the JGB/T-Note price ratio. The argument was that the major trend is pulling the ratio lower even as strong commodity prices force it higher. When the ratio gets too high for too long the weakest link available in the markets snaps. In 2007 and again in 2008 the weak link was quite clearly the major financials so a case can be made now that the ratio has spiked upwards once again that we could see a third period of crisis in the financial markets.
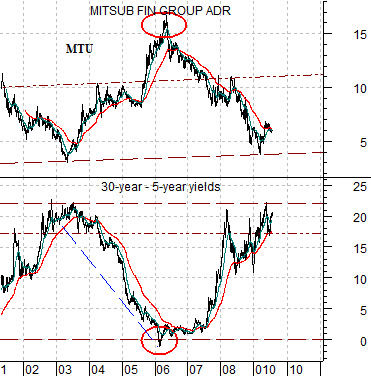
If we are carrying a bias with respect to this argument it would be that we do not believe that the major banks are going to shoulder the burden of crisis once again. At right we show a comparison between Japanese bank Mitsubishi UFJ (MTU) and the yield spread between 30-year and 5-year U.S. Treasuries.
The idea is that one should be positive on MTU when the yield spread widens out to around 2% (i.e. 20) and negative once the yield spread move below the ‘0’ line. When 30-year yields are more than 2% greater than 5-year yields the share price of MTU tends to make a bottom and when the yield spread inverts it has shown a tendency to be at a top. The point is that if the next bout of crisis widens the yield spread with 5-year yields falling faster than 30-year yields then the banks will remain under pressure but if the spread starts to decline then the onus for slower cyclical growth will most likely fall on the commodity markets.
Equity/Bond Markets
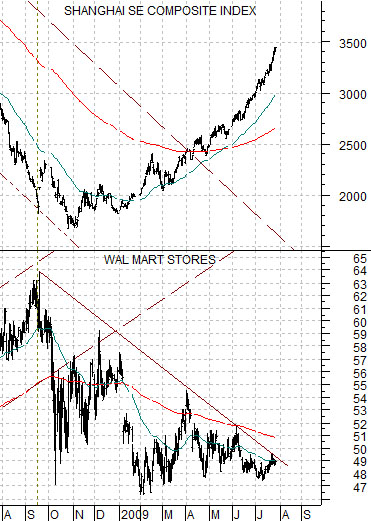
Below we compare the Shanghai Composite Index with the share price of Wal Mart (WMT). Strangely enough WMT tends to trade inversely to the kind of positive cyclical trend that drives the Asian equity markets. If the Shanghai Comp. is ever going to stop to take a breather we would expect to see WMT trading somewhat higher. At minimum it will have to cross back above its 200-day e.m.a. line (around 51).
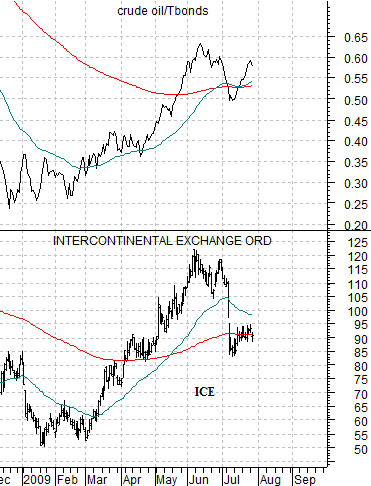
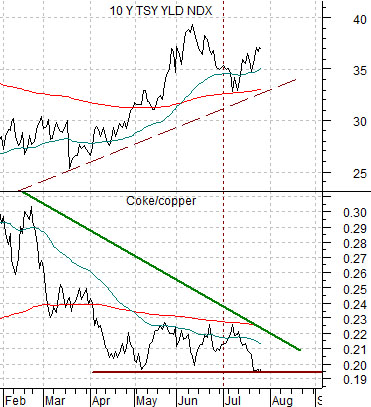
Over the past few years the markets have shifted from strong commodity through the first half of the year to weak commodity through the second half. We have argued that the Coke/copper ratio represents one side of the trade while 10-year Treasury yields represent the other. New highs for yields along with new lows for the Coke/copper ratio would suggest that this time is different. We show the chart comparison at bottom right.
July 28 (Bloomberg) — The U.S. “must seriously consider” strict position limits on energy markets to curb speculation, Commodity Futures Trading Commission Chairman Gary Gensler said.
“This hearing is an opportunity to determine how speculative position limits could be used to address excessive speculation, not how we can eliminate speculation,” Gensler said today, opening the first of three days of meetings the agency is holding on whether to restrict the volume of trading.
f the trend is going to reverse this month then our thought is that the leading edge of the trend change is shown through the share price of ICE. Notice on the chart below that it died as soon as the second quarter came to an end and it represented the basic trend that has been pushing crude oil prices higher and bond prices lower. Our sense is that if our ‘weak commodity and strong bond price’ trend is going to work we will see new lower levels for ICE in the days ahead.