In yesterday’s issue we compared the trend for the S&P 500 Index following last year’s March bottom with the initial stages of the bull market recoveries coming out of 1982 and 2003.
The argument was that the stock market rallies into 1983 and 2004 started to fade somewhat as the one year anniversary approached. Following a low in August of 1982 the momentum for the SPX began to wane somewhat in June of 1983 while the blast off in March of 2003 started to flatten out in January of 2004.
Using these two prior instances as comparisons our view was that a flatter trend through the first half of this year would make some sense.
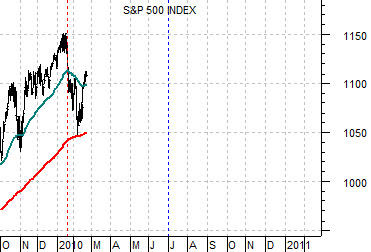
We wanted to push the argument forward somewhat today so that we can concentrate on what could take place following the end of this year’s second quarter. Our thesis was that cyclically-driven rally would work through a correction into May or June with moderate outperformance exhibited by the consumer and defensive sectors.
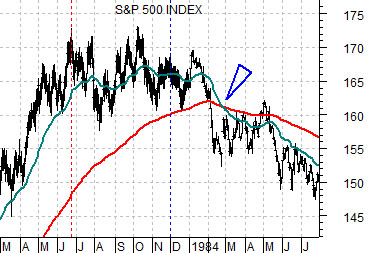
The chart below shows the SPX from March of 1983 through June of 1984. Following the start of a new bull market in August of 1982 the SPX rose to a top towards the middle of 1983 before flattening out through the balance of the year.
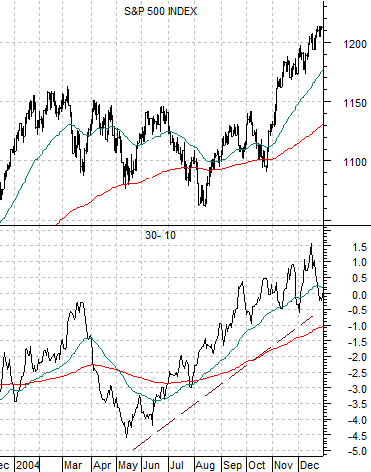
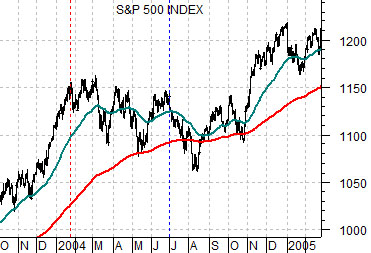
The next chart shows the SPX through the time frame following the stock market’s bottom in March of 2003. After a brisk rally that extended through the balance of the year the SPX began to consolidate early in 2004 through a series of sharp corrections back towards the 200-day moving average line (red line on chart).
The major difference between 1984 and the second half of 2004 was the SPX correction intensified in the former case with the moving average lines ‘crossing’ to the down side and faded in the latter case as the bull market reasserted itself. In 1984 the moving average lines converged and then crossed while in 2004 the moving average lines converged and then began to widen as the equity markets rallied.
Our point? If history were to be kind enough to repeat we would expect to see the SPX hold within a range bounded by around 1050 at the low and 1150 at the highs. By autumn the consolidation would have run on long enough to pull the moving average lines together at which point the markets will have to decide whether the next phase is lower (1984) or higher (2004).
Equity/Bond Markets
Our first page argument was that the equity markets appear to be settling into a trading range that could extend through the first half of the year. During the second half of the year the SPX will either push higher or shift over into a more negative trend. Since we are not that fond of mere ‘coin flips’ we thought we should show one of the factors that helped create the two opposing outcomes in 1984 and 2004.
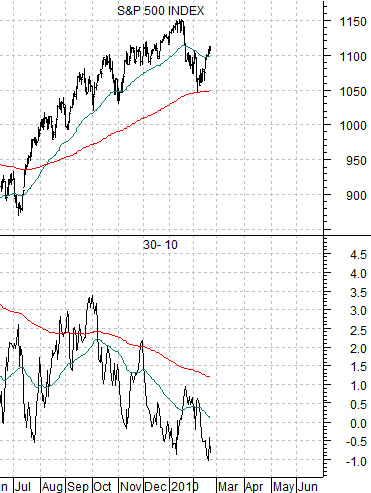
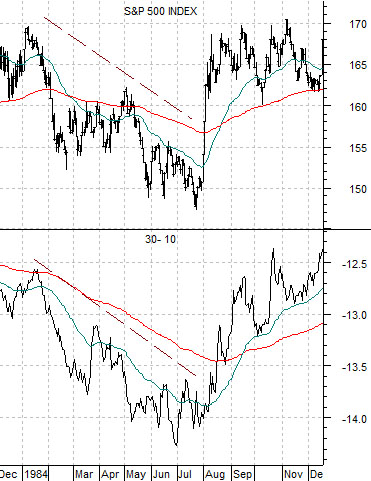
Below we show the SPX along with the price spread or difference between the 30-year and 10-year Treasury futures. We have argued that the 30-10 price spread tends to decline in response to strong and rising copper prices.
The extension of equity markets pressures through 1984 went with a lower 30-10 price spread. The stock market did not begin to recover until the downward pressure on the bond market finally eased in the summer of that year.
Next is the same comparison for 2004. Notice that the 30-10 spread reached bottom through the second quarter of that year and then helped lead the S&P 500 Index higher. The bearish outcome in 1984 revolved around falling bond prices while the bullish outcome in 2004 followed a return to rising bond prices.
Last is the current situation. Notice that the strong recovery in copper prices (along with Asian growth, energy prices, and the commodity currencies) has led to a downward trend for the 30-10 spread. Ideally- from this perspective- a weaker commodity price trend would help to lift the bond market and the spread later this year so that the equity markets are able to extend the rally into 2011.
