In terms of broad themes we remain very positive on the Japanese equity markets. The problem from our point of view is that we can still make a case for lower prices into the autumn of this year.
Perhaps the best explanation that we can put forth would be based on the way the markets trended through 2002. The ‘decade theme’ argues that cyclical trends keep repeating at the same time each decade so in a sense comparing Japan in 2012 to commodities in 2002 isn’t too much of a stretch.
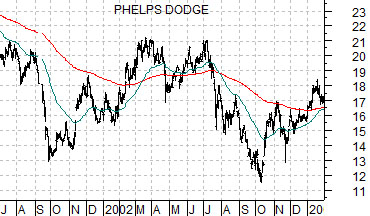
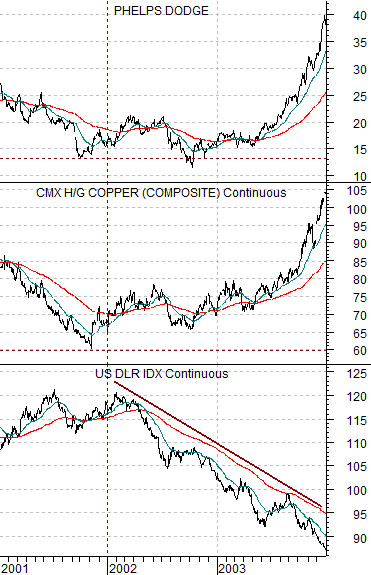
Below is a chart comparison between copper producer Phelps Dodge (we used PD years ago to represent the equity market’s reaction to changes in the trend for copper prices), copper futures, and the U.S. Dollar Index (DXY) futures from 2001 through 2003.
The argument was that the trend changed around the end of 2001 as the U.S. dollar- pumped higher by capital inflows related to the tech and telecom themes through the 1990’s- began to decline. As money started to move away from the dollar the trend for commodity prices in general and copper prices in particular started to improve.
The point is that almost everything that happened through the last decade was related in some way to capital moving away from the dollar and the pivot point for that trend change took place towards the end of 2001.
So… let’s say it is May of 2002. The dollar has turned lower and copper prices have bounced from the lows. The intermarket argument is that the dollar will decline substantially (we were making the case at the time for the DXY to fall to around 80) and that this will benefit the commodity cyclicals. Since we were using Phelps Dodge to represent this theme we were necessarily positive on the stock.
With the benefit of hindsight we can go back and see how this particular view turned out. While the trend for PD most certainly turned bullish in late 2001 the stock made ‘new lows’ into the autumn of 2002. This is exactly the ‘detail’ that we are worried about with respect to the current position of the Japanese equity markets. We believe the intermarkets have turned positive but remain concerned about the prospect of the cyclical trend slumping into the final quarter of this year.
Equity/Bond Markets
The issue in 2002 wasn’t weakness in copper prices but instead was downward pressure from the sectors that had led through the previous cycle. The dip to new lows for Phelps Dodge was largely due to the bearish pressures emanating from the large cap tech and telecom stocks.
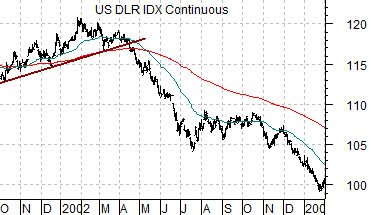
As mentioned on page 1 the shift to a bullish commodity price trend was essentially an offset to weakness in the U.S. dollar. One could argue that dollar weakness caused stronger commodity prices or that stronger commodity prices pulled capital away from the dollar but the outcome was the same either way.
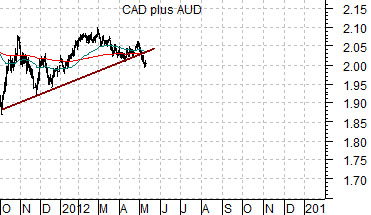
Below is a chart of the U.S. Dollar Index futures starting in October 2001. Below this we have added a chart of the sum of the Canadian and Australian (CAD plus AUD) dollar futures beginning in October of 2011.
We are comparing the commodity currencies TODAY with the U.S. dollar in 2002 and our purpose is to help explain why we were are positive on the Japanese equity markets even though we are worried about the prospect of weakness into the autumn.
We have shown the comparison between the U.S. Dollar Index in 2002 with the commodity currencies in 2012 on a number of occasions. The argument is that we could be at a tipping point for the commodity theme this spring that would lead into a very negative trend.
What does this have to do with Japan? On the one hand money moving away from the commodity theme would be negative for the producers of commodities and positive for countries like Japan that use raw materials to make consumer goods. On the other hand… cyclical is cyclical. By this we mean that the broad trends for almost all cyclical sectors tend to be similar so if we were to see weakness in the commodity currencies the markets would likely react by putting pressure on all economically sensitive sectors.
The point is that weakness in the commodity currencies would be bullish for the Japan theme in the same general way that weakness in the dollar in 2002 was positive for the commodities theme.
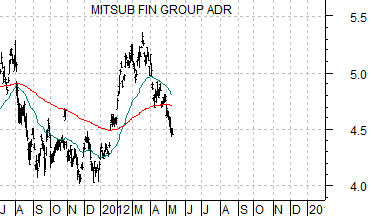
Next is a chart of Phelps Dodge from 2001 into January of 2003 and Japanese bank Mitsubishi UFJ (MTU) from 2011 to the present day.
The argument last year was that the Nikkei should reach a cycle bottom during the fourth quarter of 2011. The index made a low in November around 8200 before rallying up to 10,200 in March. At that juncture prices began to decline in response to a stronger Japanese yen and bond market.
The chart of MTU shows that the current price is still well above the bottom made last year but when we compare it to Phelps Dodge from 2002 we can’t shake the feeling that we will feel much better about our bullish view once we get on the other side of October this year.
A return to a bullish trend should go with a weaker yen and declining bond prices.