In a recent issue we commented in passing that Coca Cola (KO) was effectively ‘stuck’ around the 66 level. Ironically the stock crossed into the 67’s the following day. So much for being stuck.
We wanted to quickly run through the intermarket forces working on the share price of Coke these days because the arguments cross over into quite a number of themes and markets.
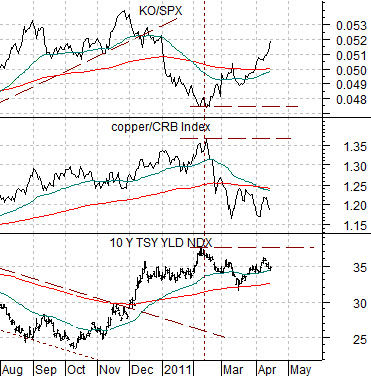
Below is a comparison between 10-year Treasury yields, the ratio between copper and the CRB Index, and the ratio between KO and the S&P 500 Index.
To make this as simple as possible… when copper weakens relative to the CRB Index you tend to get downward pressure on yields. When yields are falling the defensive stocks (i.e. Coke) tend to rise relative to the broad market. In other words there is a link between copper and Coke that works through the Treasury market.
When copper prices began to decline on relative basis in February as the commodity markets shifted focus over to the energy sector the trend for yields shifted from higher to lower while the stock price of Coke pivoted from being weaker than the market to being consistently stronger. Fair enough.
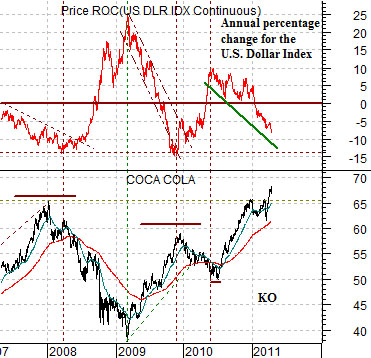
The second positive ‘driver’ for Coke is the weaker U.S. dollar. One might think that dollar weakness helps commodity prices and than an upward squeeze on consumer products inputs would be a negative for a soft drink maker but… Coke seems to do quite nicely during periods of dollar weakness.
The trick here is that the trend for KO is inverse to the trend for the dollar on a year-over-year basis. Not the dollar on a year-over-year basis but the trend for the annual percentage Rate of Change (ROC).
When the annual %age ROC is declining the share price of KO tends to rise and the when the ROC is rising the share price of KO is usually declining. The chart shows that recent dollar bottoms have been made when the ROC approaches roughly -15% (we will continue with this thought on page 3 today).
The point is that weaker copper and flat to lower yields are helping to push KO higher even as the persistently weak dollar helps to hold the trend positive.
Equity/Bond Markets
Continuing on… while Coke’s share price may swing off of copper price weakness this also impacts our ‘laggard banks’ theme. And… not in a good way.
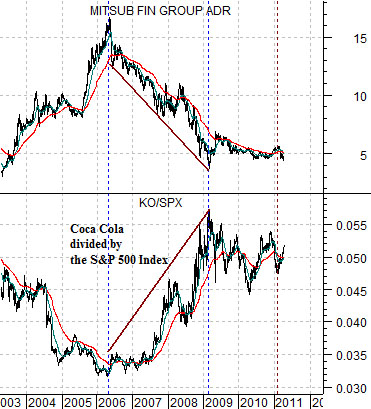
Below we compare the KO/SPX ratio with the share price of Japanese bank Mitsubishi UFJ (MTU). The fairly obvious point is that a strong KO/SPX ratio (notice that the ratio bottomed in the spring of 2006 which also happened to mark the last cycle to for copper prices) goes with a bearish trend for MTU. The argument is that the longer KO outperforms the broad market as long-term yields resolve to the down side the greater the pressure on the laggard banks theme.
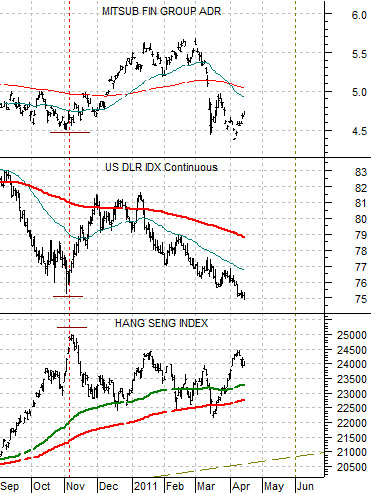
At right is a chart of MTU, the DXY futures, and Hong Kong’s Hang Seng Index.
We noticed that the last rally for the laggard banks (i.e. MTU) began in early November of last year when the Hang Seng Index peaked and the dollar bottomed. If Hang Seng weakness and dollar strength are a positive for MTU then… perhaps we should put together a composite of the Hang Seng Index divided by the DXY. So… we did.
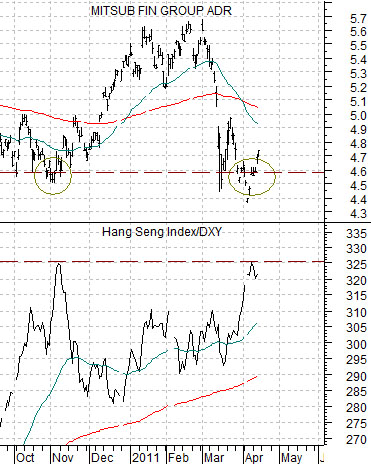
The chart below compares MTU with the Hang Seng Index/U.S. Dollar Index ratio.
This may turn out to be pure coincidence but when the ratio peaked in early November last year the share price of MTU was around 4.60- 4.70. Early this month the ratio made a peak at the exact same chart point and… after a big rise into February and a complete crushing through March we find the share price of MTU right back to the 4.60- .4.70 range.
The point? With the Hang Seng Index topping out around 2% under last November’s peak the dollar can move somewhat under last year’s bottom while holding the Hang Seng/DXY ratio at or below the highs with the prospect of another rising price for MTU beginning this month.