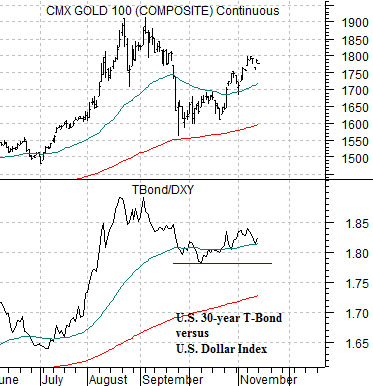
For the umpteenth time… we are going to lead off with the comparison between gold futures prices and the ratio between the U.S. 30-year T-Bond futures and U.S. Dollar Index (DXY).
One argument would be that the S&P 500 Index is now roughly 70% of the price of gold after touching close to 60% earlier this year. The SPX has not been this low relative to the price of gold since the 1985- 88 time frame. When the ratio began to rally in 1989 it hit first resistance just over 100% (i.e. gold and the SPX at similar price levels). Eventually the SPX peaked around 5.5 times the price of gold in 2000 before grinding lower once again.
Our thought has been that… one of these days… either the SPX is going to rise towards the price of gold or gold prices are going to decline back towards the SPX as the ratio snugs back towards 1:1. From an intermarket point of view the only way gold prices are going to decline in a meaningful fashion is if the TBond/DXY ratio breaks lower and for that to happen we will need to see a stronger dollar and a much weaker bond market.
The point In recent years the markets have basically been doing one of two things. Either driving the dollar AND the bond market higher during periods of crisis or selling the dollar AND bond market lower as cyclical growth improves. What we continue to look for is a somewhat different outcome featuring a better dollar at the same time that bond prices decline.
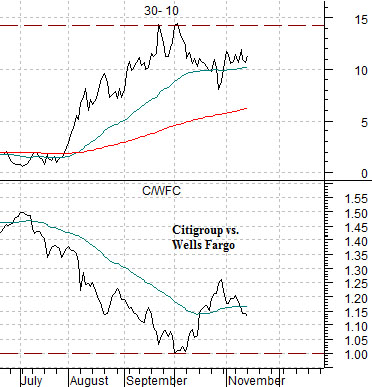
At bottom right is a comparison between the price spread or difference between the 30-year and 10-year Treasury futures (the spread rises and falls with bond prices) and the ratio between Citigroup (C) and Wells Fargo (WFC).
This is probably an overly complicated way of looking at the markets but the idea is that if the 30-10 spread has peaked then we are already into a recovery while if the C/WFC ratio has bottomed we are in the early stages of a recovery that will include better action in the laggard banks.
These two combinations represent reasonable ‘stops’ for the argument that the trend has already turned positive. New highs for the 30-10 spread combined with a close below 1:1 for the C/WFC ratio suggests that the markets are once again heading down the rabbit hole.
Equity/Bond Markets
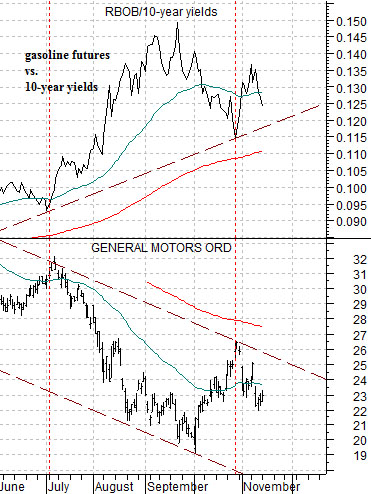
The argument is that the sharp rise in Brent crude oil prices drove fuel costs higher this year creating a bearish trend for the energy ‘user’ sectors. An end to the rising energy price trend should go with a recovery for the energy ‘users’.
At right is a chart of General Motors (GM) and the ratio between gasoline futures (RBOB) and 10-year Treasury yields.
GM hit the channel top in July and October when the gasoline/yields ratio declined to support. What we are looking for is a concurrent break up through the channel top for GM (i.e. above 26) and down through the support line for the gasoline/yields ratio.
We are going to get ‘macro’ now. Below is a somewhat interesting perspective on what the markets have been doing over the past few years.
The chart compares Boston Scientific (BSX), the Canadian dollar (CAD) futures, and the Kuwait Stock Exchange Index. We only have data for the Kuwait SE Index back to 2002.
From 1993 into 2004 the Canadian dollar traded below .78 while the share price of BSX trended generally higher.
In 2004 crude oil and heating oil futures prices broke to new all time highs and this served to ‘split’ the markets as strong commodity prices pushed interest rates higher. As the Canadian dollar moved above .78 the share price of BSX began to decline.
If BSX trends higher when the Cdn dollar is under .78 then perhaps it makes sense that the stock continues to wallow near the lows. The detail that we found intriguing relates to the way the Kuwait SE Index has now declined back to the levels associated in 2004 with the break out above .78 by the Cdn currency.
The point General Motors has been squeezed lower by stronger energy prices while the Canadian dollar has been pushed higher. Fair enough. There are any number of ways for the trend to progress but as we looked at the way the Kuwait stock market had declined back to the levels of 2004 we couldn’t help but wonder whether the Cdn dollar was already in a bear market on its way back to .78. We have included a chart comparison on page 4 (top right) to put this into some form of perspective.