We argued a few weeks back that the S&P 500 Index would correct lower with the initial decline in the Asian equity markets. With the SPX closing higher over the past two trading sessions it is possible that indices like the Shanghai Comp. and Hang Seng have found first support.
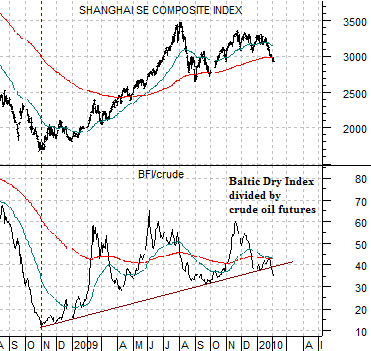
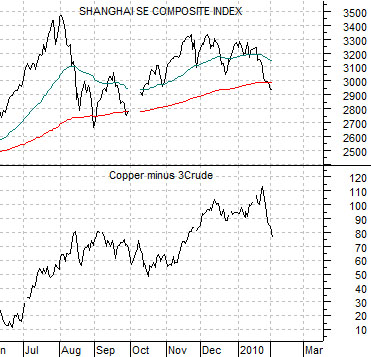
We are starting off today with three comparative charts that argue that the base trend for the Asian equity markets could still be negative. At top right the ratio between ocean freight rates (Baltic Dry Index) and crude oil future prices has broken the rising support line. Below the shift over to relative weakness for copper prices compared to crude oil prices is also an indication of a negative trend for the Shanghai Comp.
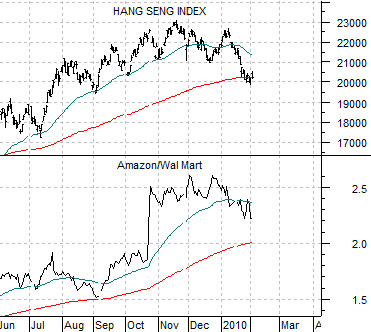
Below is a comparison between Hong Kong’s Hang Seng Index and the ratio between Amazon (AMZN) and Wal Mart (WMT). The Asian growth trend tends to be positive when AMZN is outperforming WMT so recent declines in the ratio suggest- at minimum- the potential for additional down side risk in the Hang Seng Index. The point is that a few cracks are starting to show up in the trend that has been driving asset prices higher since the end of 2008.
Equity/Bond Markets
We launched into a rather protracted ramble in yesterday’s issue so we thought we would try to pull together the key points into a one-page argument today.
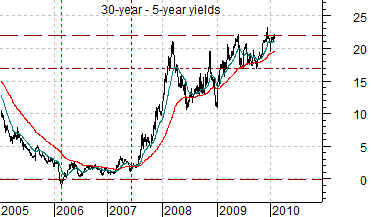
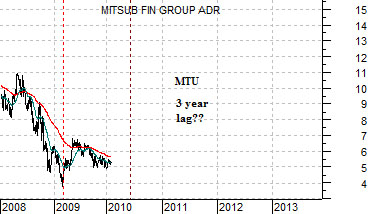
1) 3-year lag: The idea was that the share price of Japanese bank Mitsubishi UFJ (MTU) has been lagging behind the U.S. yield curve (30-year minus 5-year yields) by three years. The yield curve bottomed in early 2000 and MTU bottomed in early 2003. The yield curve peaked in mid-2003 and MTU peaked in mid-2006. The yield curve then bottomed once again in early 2006 with MTU reaching a low in March of 2009.
If we take the argument absolutely literally MTU would continue to trend essentially sideways through the second quarter this year before swinging back to the upside.
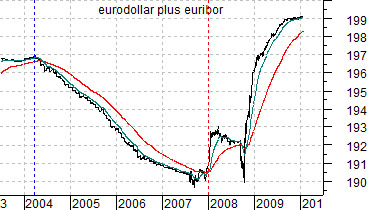
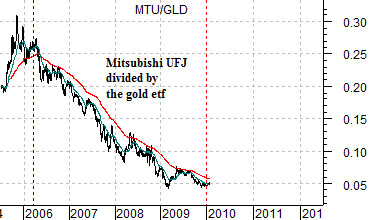
2) 2-year lag: The charts below are set up to suggest that the ratio between MTU and gold prices is lagging behind short-term debt prices by two years. Falling debt prices (i.e. rising short-term yields) from 2004 into 2007 led to downward pressure on the financials (MTU) and upward pressure on gold prices from 2006 into 2009.
The basic point is that rising short-term debt prices (falling yields) in 2008 should start to work as a positive for the banks relative to gold prices over the next two years.
3) 15-month lag: We have compared the current cycle to 1990- 92 on many occasions in the past. The idea was that the recovery begins from the relative strength peak for the oil stocks- an event that took place in October of 1990 and March of 2009.
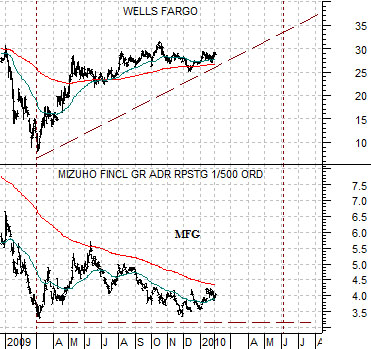
When the trend turned positive in 1990 a number of key financials (i.e. Citicorp) remained under pressure for a full 15 months only to swing sharply higher at the start of 1992. If history were to repeat exactly then stocks like Wells Fargo (WFC) would continue to resolve higher with Japanese banks like Mizuho (MFG) and MTU joining the rising trend towards the end of the second quarter.
