It really has felt like a ‘sell the news’ equity market this month. Our problem is that while a market that keeps rising feels like an accident waiting to happen we haven’t had any particular reason to be negative. That may have changed yesterday but at time of writing we are still doing our best to stay the bullish course.
We have this thing about 9-month intervals (unrelated to the human pregnancy cycle of course). It may be simply a matter of coincidence or, perhaps, a function of imaginative charting but during cyclical down turns there does seem to be something about a 3-quarter or 9-month lag that merits our attention.
Nine months have elapsed (more or less) since the most recent peak in the ratio of crude oil to the CRB Index. With this in mind we take a trip back in time to the 19097- 98 time frame.
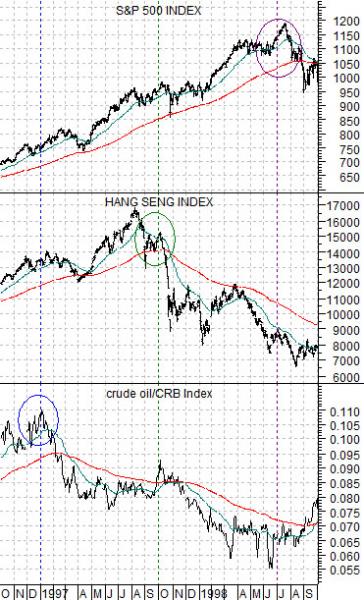
At the start of 1997 the crude oil/CRB Index ratio reached a peak. This top went with the absolute and relative highs for energy prices and the start of a drain of capital away from the various themes (emerging/Asian/Latin/commodity currencies) associated with a stronger energy price theme.
The twist was that the markets responded to downward pressure on energy prices in a remarkably upbeat way. For the first nine months of 1997 the Hang Seng Index from Hong Kong trended higher only to ‘crash’ at the start of the final quarter of the year.
Our first point is that the peak for the crude oil/CRB Index ratio preceded the collapse in the Hong Kong stock market by nine months.
The S&P 500 Index essentially flattened out as the Hang Seng Index moved lower but by January of 1998 the Hang Seng began to bounce while the SPX resumed its rising trend. The next serious bout of pressure hit the markets in the summer of 1998 as the outflow of capital away from Asian led to a crisis throughout Singapore, Thailand, Indonesia, Malaysia, and the Philippines to be followed shortly thereafter similar crises in Russia and Brazil.
Our second point is that the Asian crisis and decline in the SPX occurred nine months after the 1997 decline in the Hang Seng Index which trailed the relative strength peak for energy prices by a similar length of time.
Equity/Bond Markets
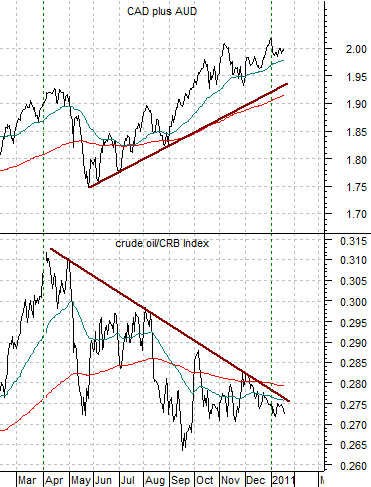
Below we show the crude oil/CRB Index ratio and the sum of the Canadian and Australian (CAD plus AUD) dollar futures from the current time period.
We have mentioned (quite often) that the crude oil/CRB Index tends to trend with the commodity currencies. What we have seen over the past nine months is a downward trend for energy prices relative to the broad list of commodity prices without a clear indication of capital fleeing the theme that would show up through a declining trend for the commodity currencies.
In other words… if crises follow capital outflows from a sector and to date capital hasn’t abandoned the commodity theme… then our sense is that a potential crisis is still nine or more months out into the future. If the commodity currencies were to start to weaken this month then we would look for one or more markets to ‘bust’ later this autumn.
We have mentioned two potential outcomes. First, energy prices could simply be taking a breather with rapid gains in crude oil futures to come during 2011 as the crude oil/CRB Index ratio swings higher. Second, the 9-month lag leads to dollar strength and the start of a flow away from the commodity currencies as the CAD plus AUD track lower.
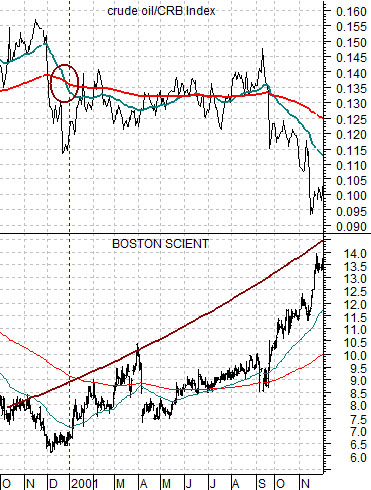
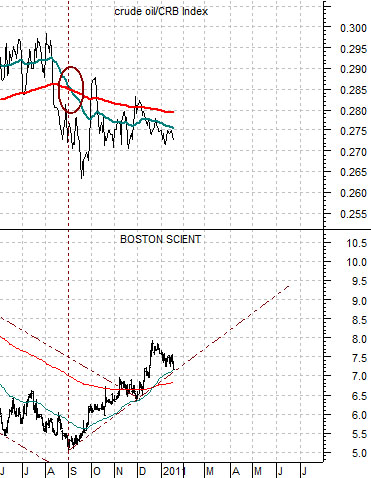
Below are two charts of the crude oil/CRB Index ratio and the share price of Boston Scientific (BSX). In 2000 (chart at top right) the trend for BSX turned positive as the two moving average lines for the crude oil/CRB Index ‘crossed’ to the down side. We mention this because the cycle bottom for BSX last year occurred as the moving averages ‘crossed’ to the down side once again.