
We are going to blaze far too quickly through a very important topic. The premise is that one should favor or be long those sectors that are putting upward pressure on interest rates while avoiding or being short those sectors that are putting downward pressure on yields.
We start our argument back in the 2000- 2004 time period. At top right is a comparison between heating oil futures (we could have used crude oil but this should suffice) and the ratio between U.S. 3-month TBill yields and 30-year Treasury yields. Note that when the ratio rises above 1.0 it means that the yield curve is inverted with 3-month yields higher than 30-year yields.
The yield curve inversion in 2000 led to a slump in cyclical growth and yields. The trend from the end of 2000 into 2003 was marked by a paucity of economic ‘traction’. However, as energy prices began to grind back to the old highs the cyclical trend started to tighten up somewhat until in 2004 heating oil and crude oil futures prices moved to new highs.
Energy prices declined with yields in 2000 and then pushed yields higher in 2004. This became the dominant and most profitable theme over the next number of years.
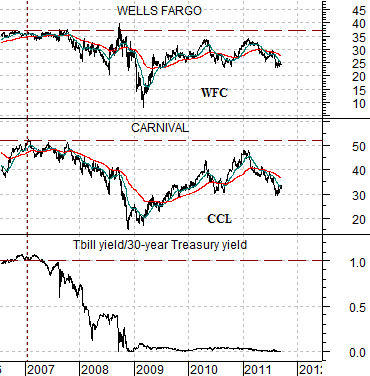
Below is a comparison between Wells Fargo (WFC), Carnival (CCL), and the TBill/30-year yield ratio.
The argument is that the yield curve inverted once again around the end of 2006 and into early 2007. What we are searching for are stocks or sectors that declined with interest rates during 2007 and 2008 but were now within striking distance of making new highs. In other words… charts that appear similar today to that of crude oil and heating oil back in 2003- 04.
We use Wells Fargo to represent the relative strength leaders of the U.S. banking system. Carnival, on the other hand, represents the energy ‘user’ consumer cyclical theme. In general the trends for WFC and CCL are so similar that we tend to believe that they represent the same basic theme.
So… what if WFC and CCL push to new highs over the next few months or quarters? What if the push to new highs goes with or starts the process of lifting interest rates? The argument would be that these are the kind of sectors- similar to energy prices in 2004- that will drive the markets over the next few years.

Equity/Bond Markets
Next is a comparison between Carnival Cruise Lines (CCL) and the ratio between Brent crude oil futures and the CRB Index.
We tend to use individual stocks to represent broader themes. This makes sense in some cases and is a bit of a stretch for others. The oil producers and oil service stocks are reasonable surrogates for the energy trend while the mining stocks are an obvious choice to represent base metals prices as are the fertilizer stocks for grains prices.
How does one represent what has recently been termed ‘middle-class malaise’? How do we show the trend for discretionary consumer spending as an offset to energy prices? One way is through the share price of Carnival. We hope.
The chart below suggests that the offset to the rampaging trend for gasoline and Brent crude oil futures this year has been an equally bearish trend for CCL. The suggestion would be that as long as CCL is trending lower the markets are still focusing on one or more facets of the energy price trend.
Following the release of quarterly earnings yesterday CCL’s share price rose modestly. A 5% gain is what we call ‘modest’ because we would have been more impressed with a price gap back above the 200-day e.m.a. line.
Lastly is our chart of the sum of the share prices of Wells Fargo and Carnival (WFC plus CCL).
The idea is that WFC and CCL have similar trends so they seem to be reacting in the same basic manner to external trend changes. The sum of the two stocks lifted higher in September of 2009 and September of 2010 with the subsequent rallies pushing on into the start of the next year.
If history were to be kind enough to repeat… the reaction to CCL’s earnings yesterday would be the start of a positive trend that would run into 2012 with offsetting weakness through the fourth quarter this year from energy prices.


